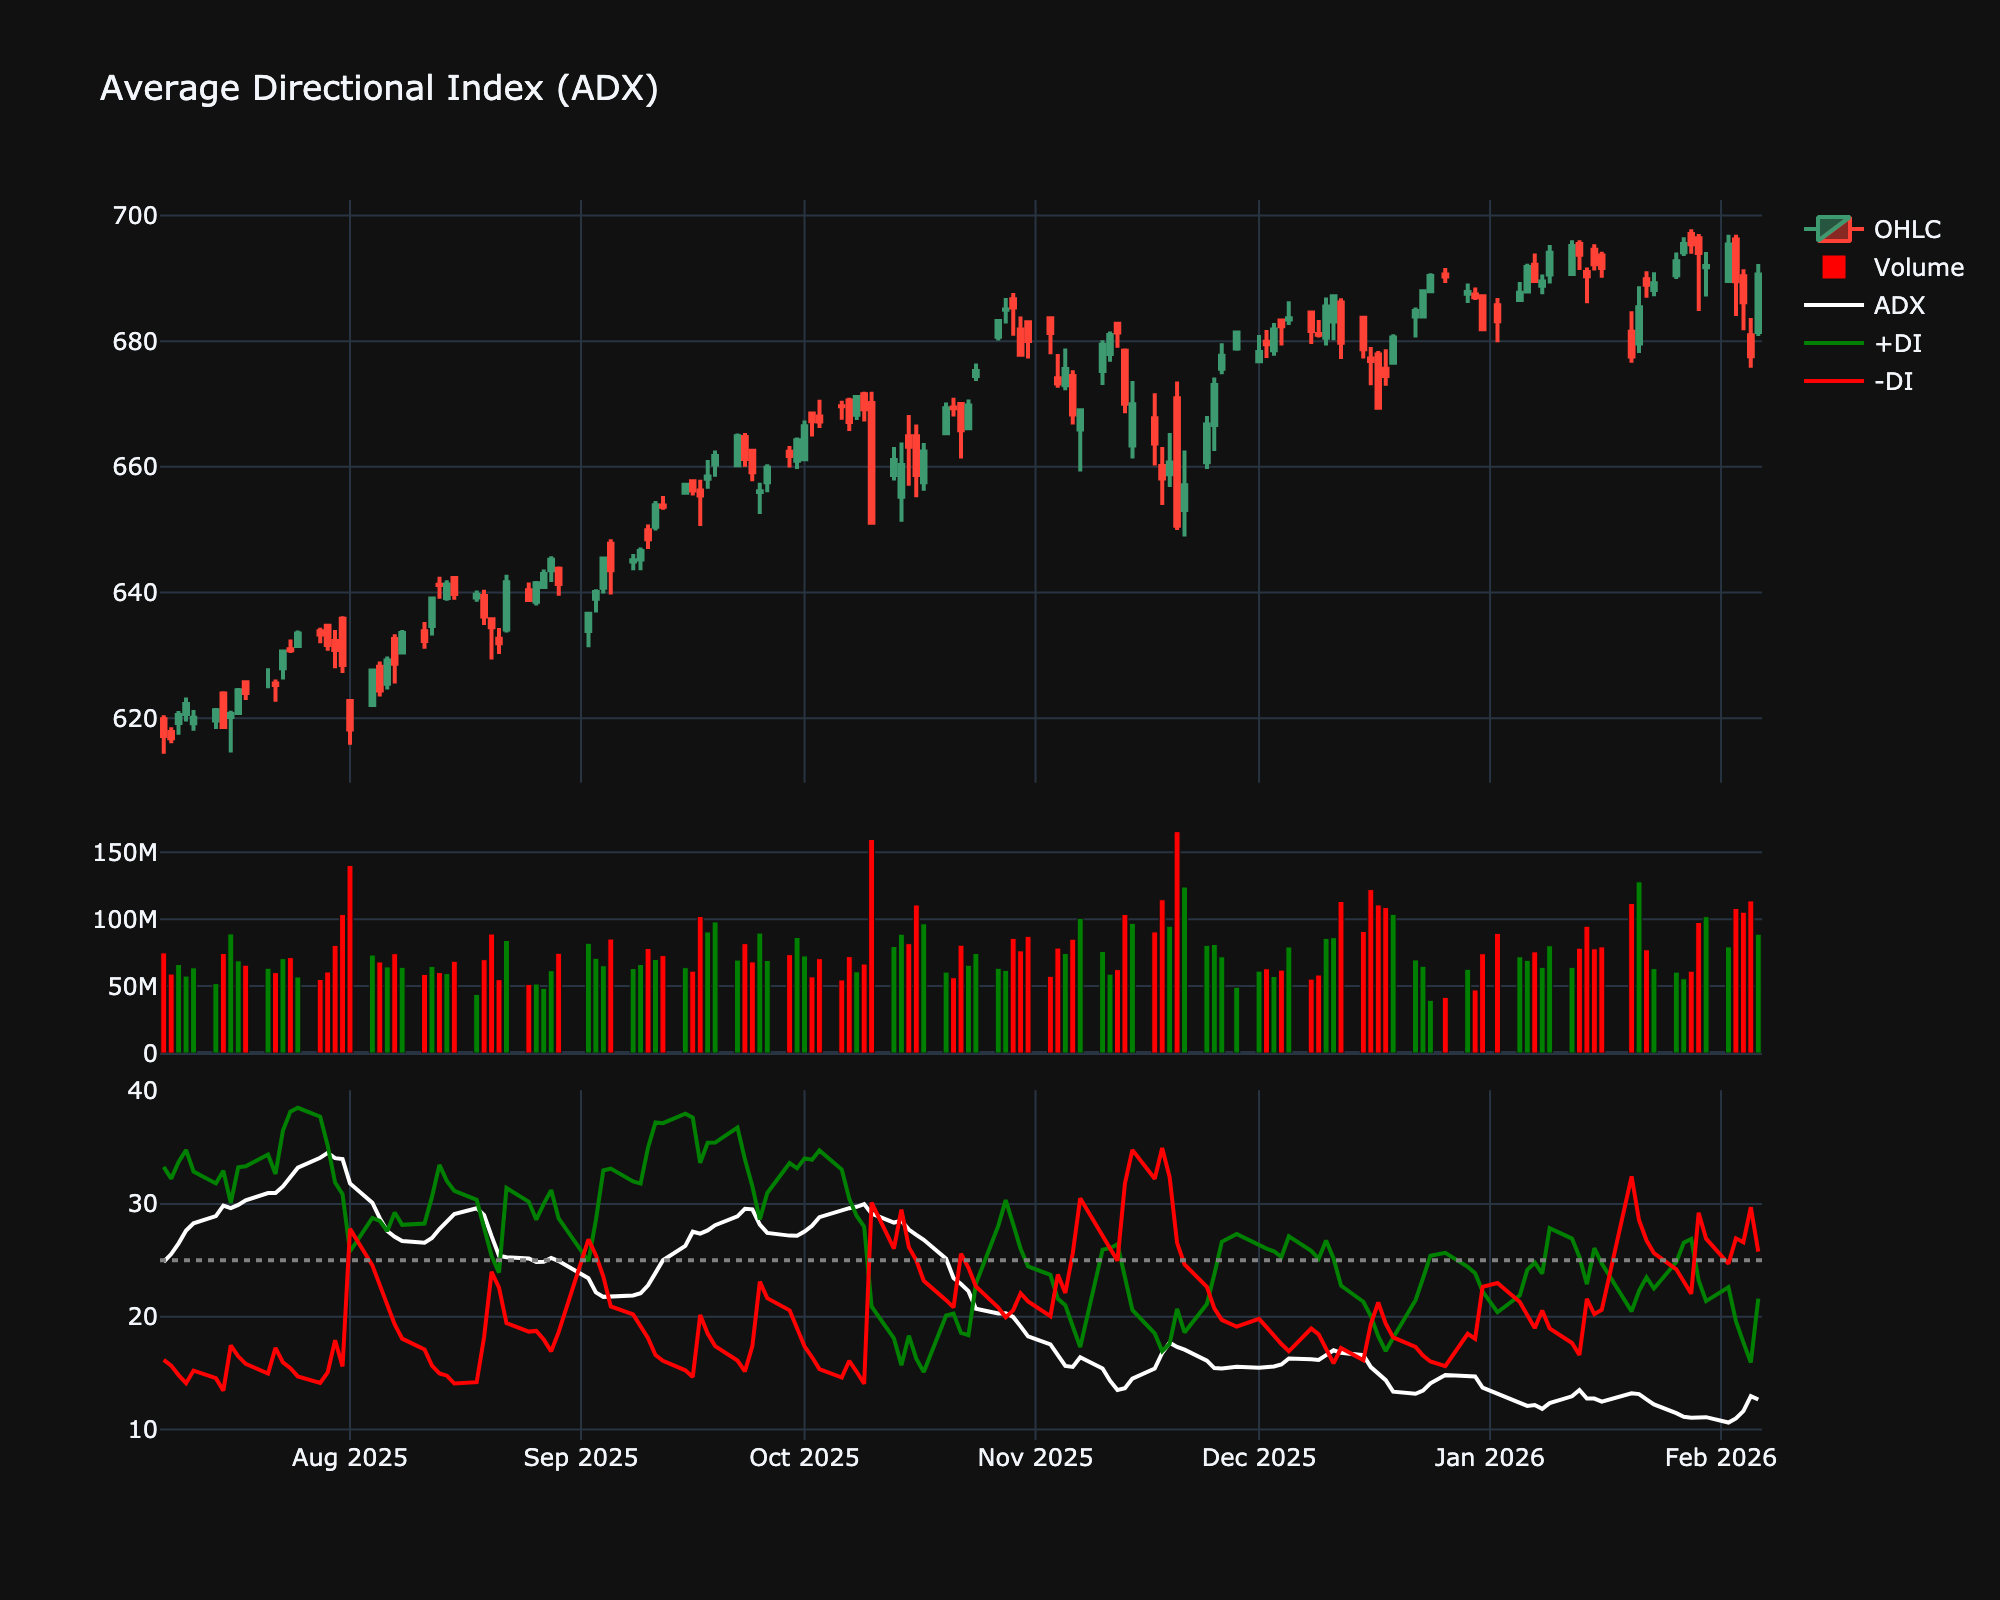
Average Directional Index (ADX)
| Name | Type | Prerequisite | Use Cases |
|---|---|---|---|
| Average Directional Index (ADX) | Trend | EMA | Determining if a market is trending or ranging (values > 25). |
Definition
The Average Directional Index (ADX) is used to quantify the strength of a trend. ADX stands for Average Directional Movement Index and is used to measure the overall strength of a trend. The ADX indicator is an average of expanding price range values.
Mathematical Equation
\[
+DI = 100 \times \frac{\text{EMA}(+DM)}{\text{ATR}}
\]
\[
-DI = 100 \times \frac{\text{EMA}(-DM)}{\text{ATR}}
\]
\[
DX = 100 \times \frac{|(+DI) - (-DI)|}{(+DI) + (-DI)}
\]
\[
ADX = \text{EMA}(DX)
\]
Special cases
- Maximum possible value: 100
- Minimum possible value: 0
- Behavior: Oscillates independently between 0 and 100 to indicate the strength of a trend, not the direction.
Visualization
Trading Significance
-
Trend Strength: ADX > 25 indicates a strong trend (either up or down). ADX < 20 indicates a weak or non-existent trend.
-
Direction: If +DI > -DI, trend is bullish. If -DI > +DI, trend is bearish.