Bollinger %B
| Name | Type | Prerequisite | Use Cases |
|---|---|---|---|
| Bollinger %B (%B) | Momentum | OHLC Data | Identifying specific breakout or mean-reversion triggers. |
Definition
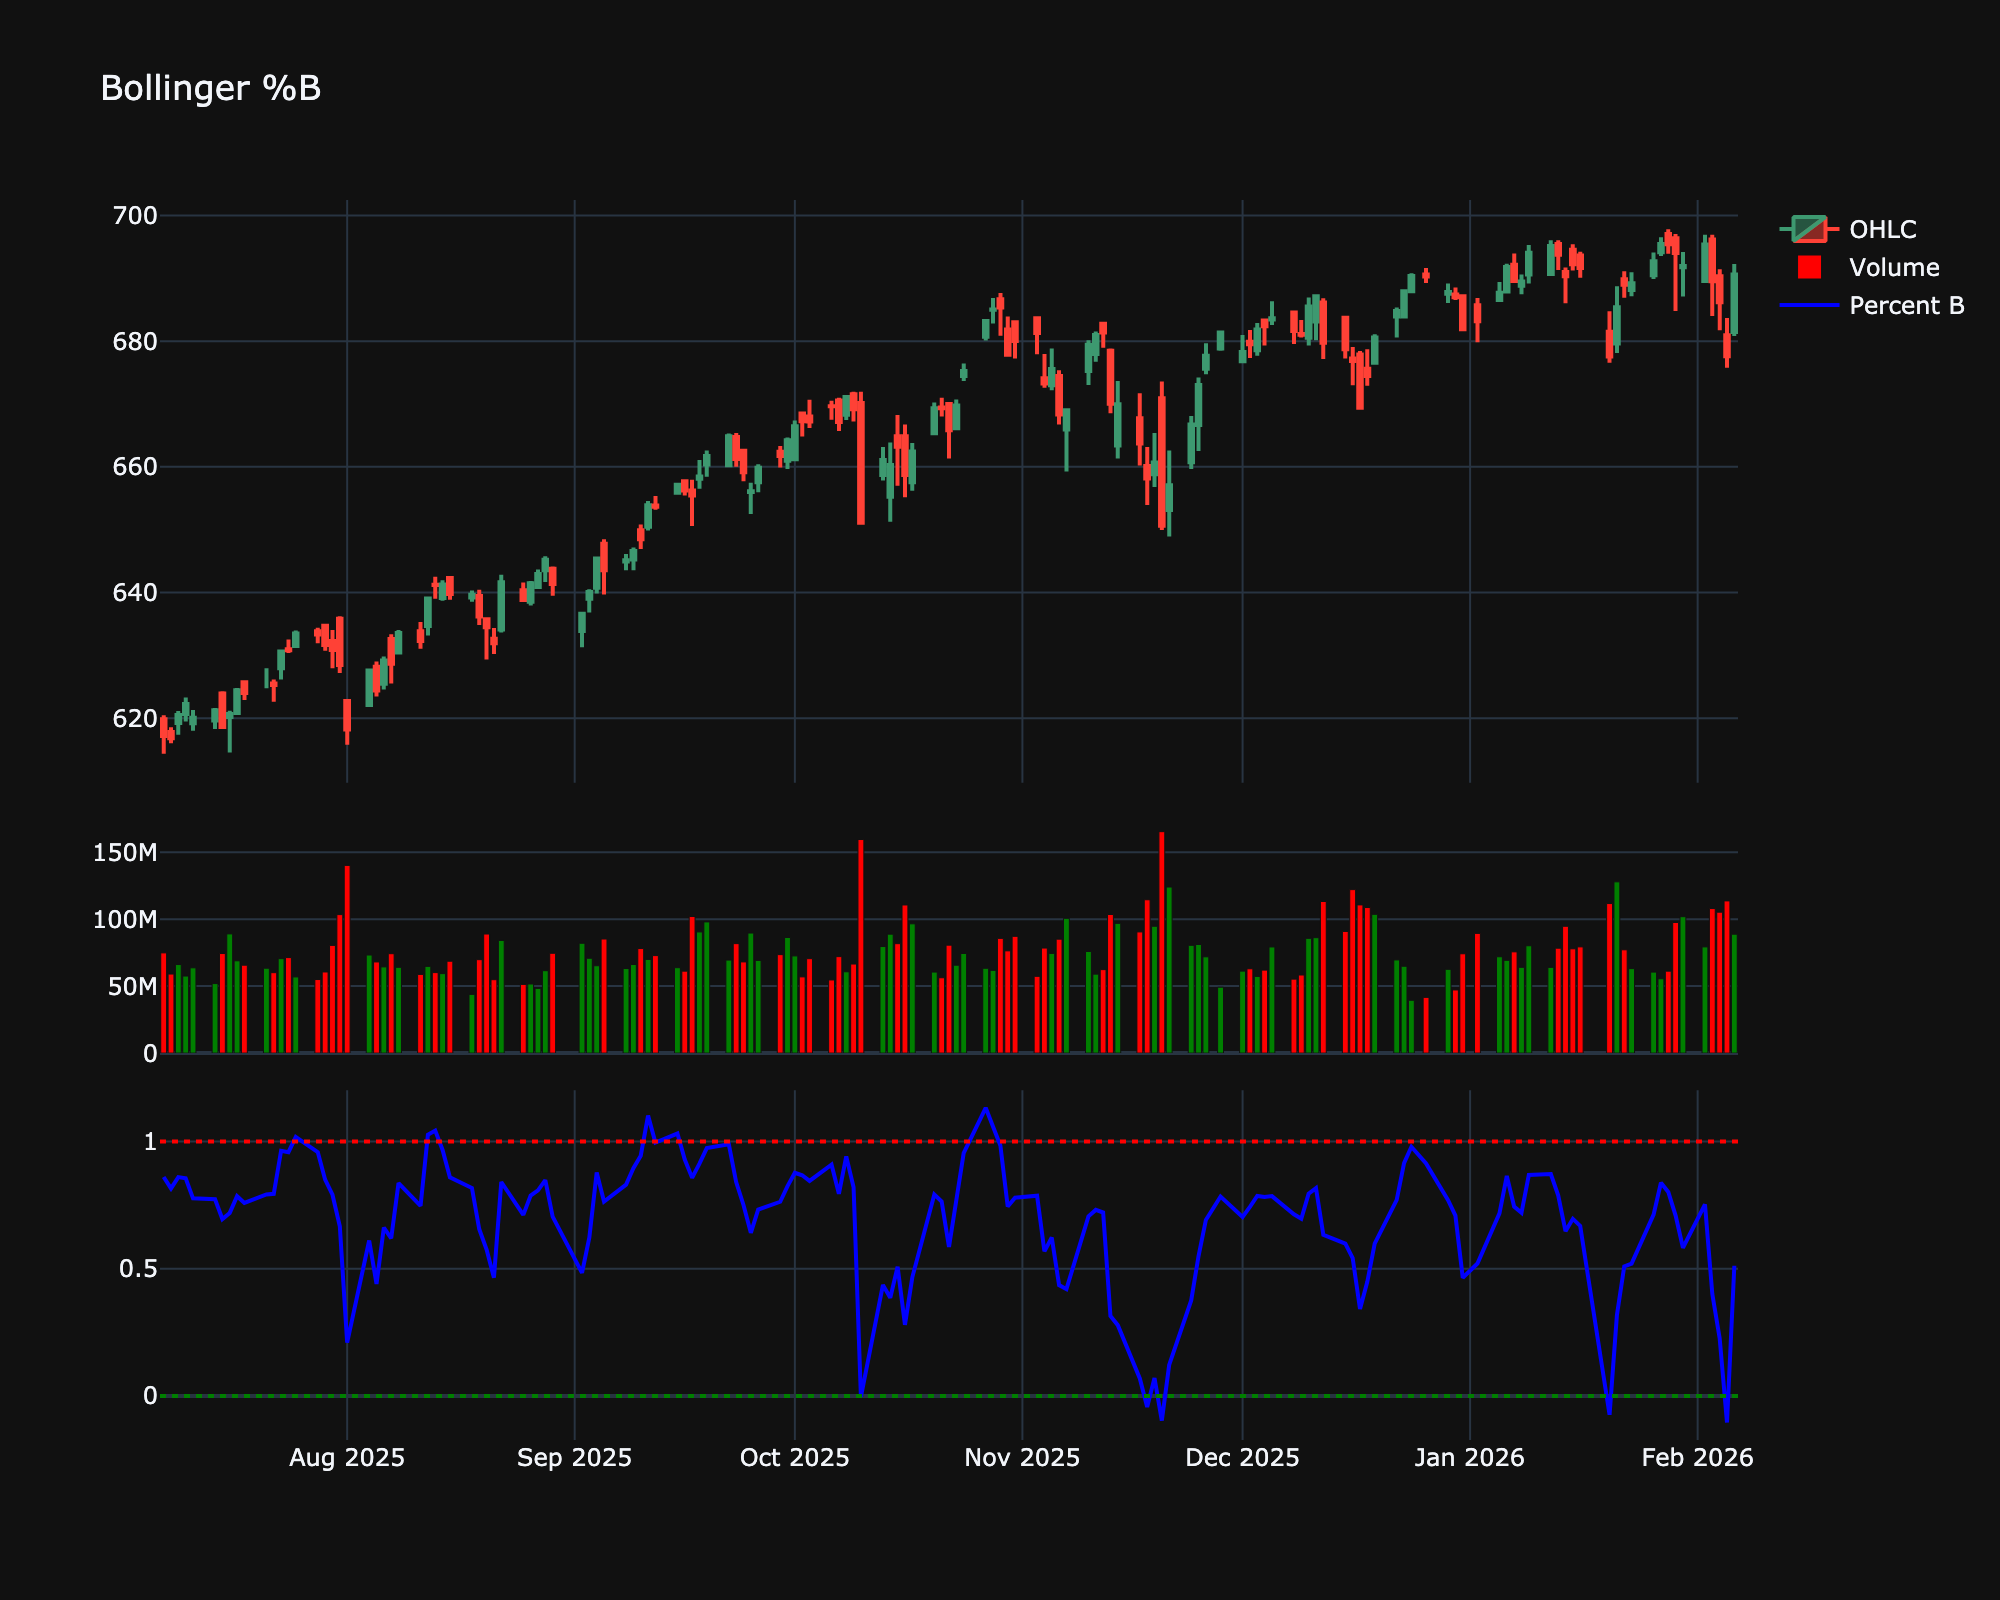
Bollinger %B (Percent B) quantifies a security's price relative to the upper and lower Bollinger Band. It acts as an oscillator, indicating where the price is within the bands.
Mathematical Equation
\[
\%B = \frac{\text{Price} - \text{Lower Band}}{\text{Upper Band} - \text{Lower Band}}
\]
-
\%B = 1: Price is at the Upper Band.
-
\%B = 0: Price is at the Lower Band.
-
\%B > 1: Price is above the Upper Band.
-
\%B < 0: Price is below the Lower Band.
Special cases
- Maximum possible value: Unbounded (typically near 0 to 1)
- Minimum possible value: Unbounded
- Behavior: Oscillates around 0 and 1. Values > 1 mean price is above the upper band, < 0 means below the lower band.
Visualization
Trading Significance
-
Overbought/Oversold: Readings above 1.0 (or near 1.0) can signal overbought conditions, while readings below 0.0 (or near 0.0) can signal oversold conditions.
-
Trend Identification: In a strong uptrend, price tends to hug the upper band, keeping %B typically above 0.5.
-
Divergence: Divergences with MFI or RSI can validate reversals using %B levels.