Klinger Oscillator
| Name | Type | Prerequisite | Use Cases |
|---|---|---|---|
| Klinger Oscillator (KO) | Volume | EMA | Long-term trend confirmation and short-term timing. |
Definition
The Klinger Oscillator (KO) was developed by Stephen Klinger to determine the long-term trend of money flow while remaining sensitive enough to detect short-term fluctuations. It compares the volume flowing in and out of a security to price movement, and it is then turned into an oscillator.
Mathematical Equation
The calculation is complex but involves:
-
Defining the Trend Direction using High, Low, and Close.
-
Calculating Volume Force (\(VF\)) using volume, trend, and a temp value based on price range.
-
Calculating two EMAs of \(VF\) (typically 34-period and 55-period).
- A Signal Line (usually 13-period EMA of KO) is plotted.
Special cases
- Maximum possible value: Unbounded
- Minimum possible value: Unbounded
- Behavior: Oscillates around zero, measuring volume volume flows across different timeframes.
Visualization
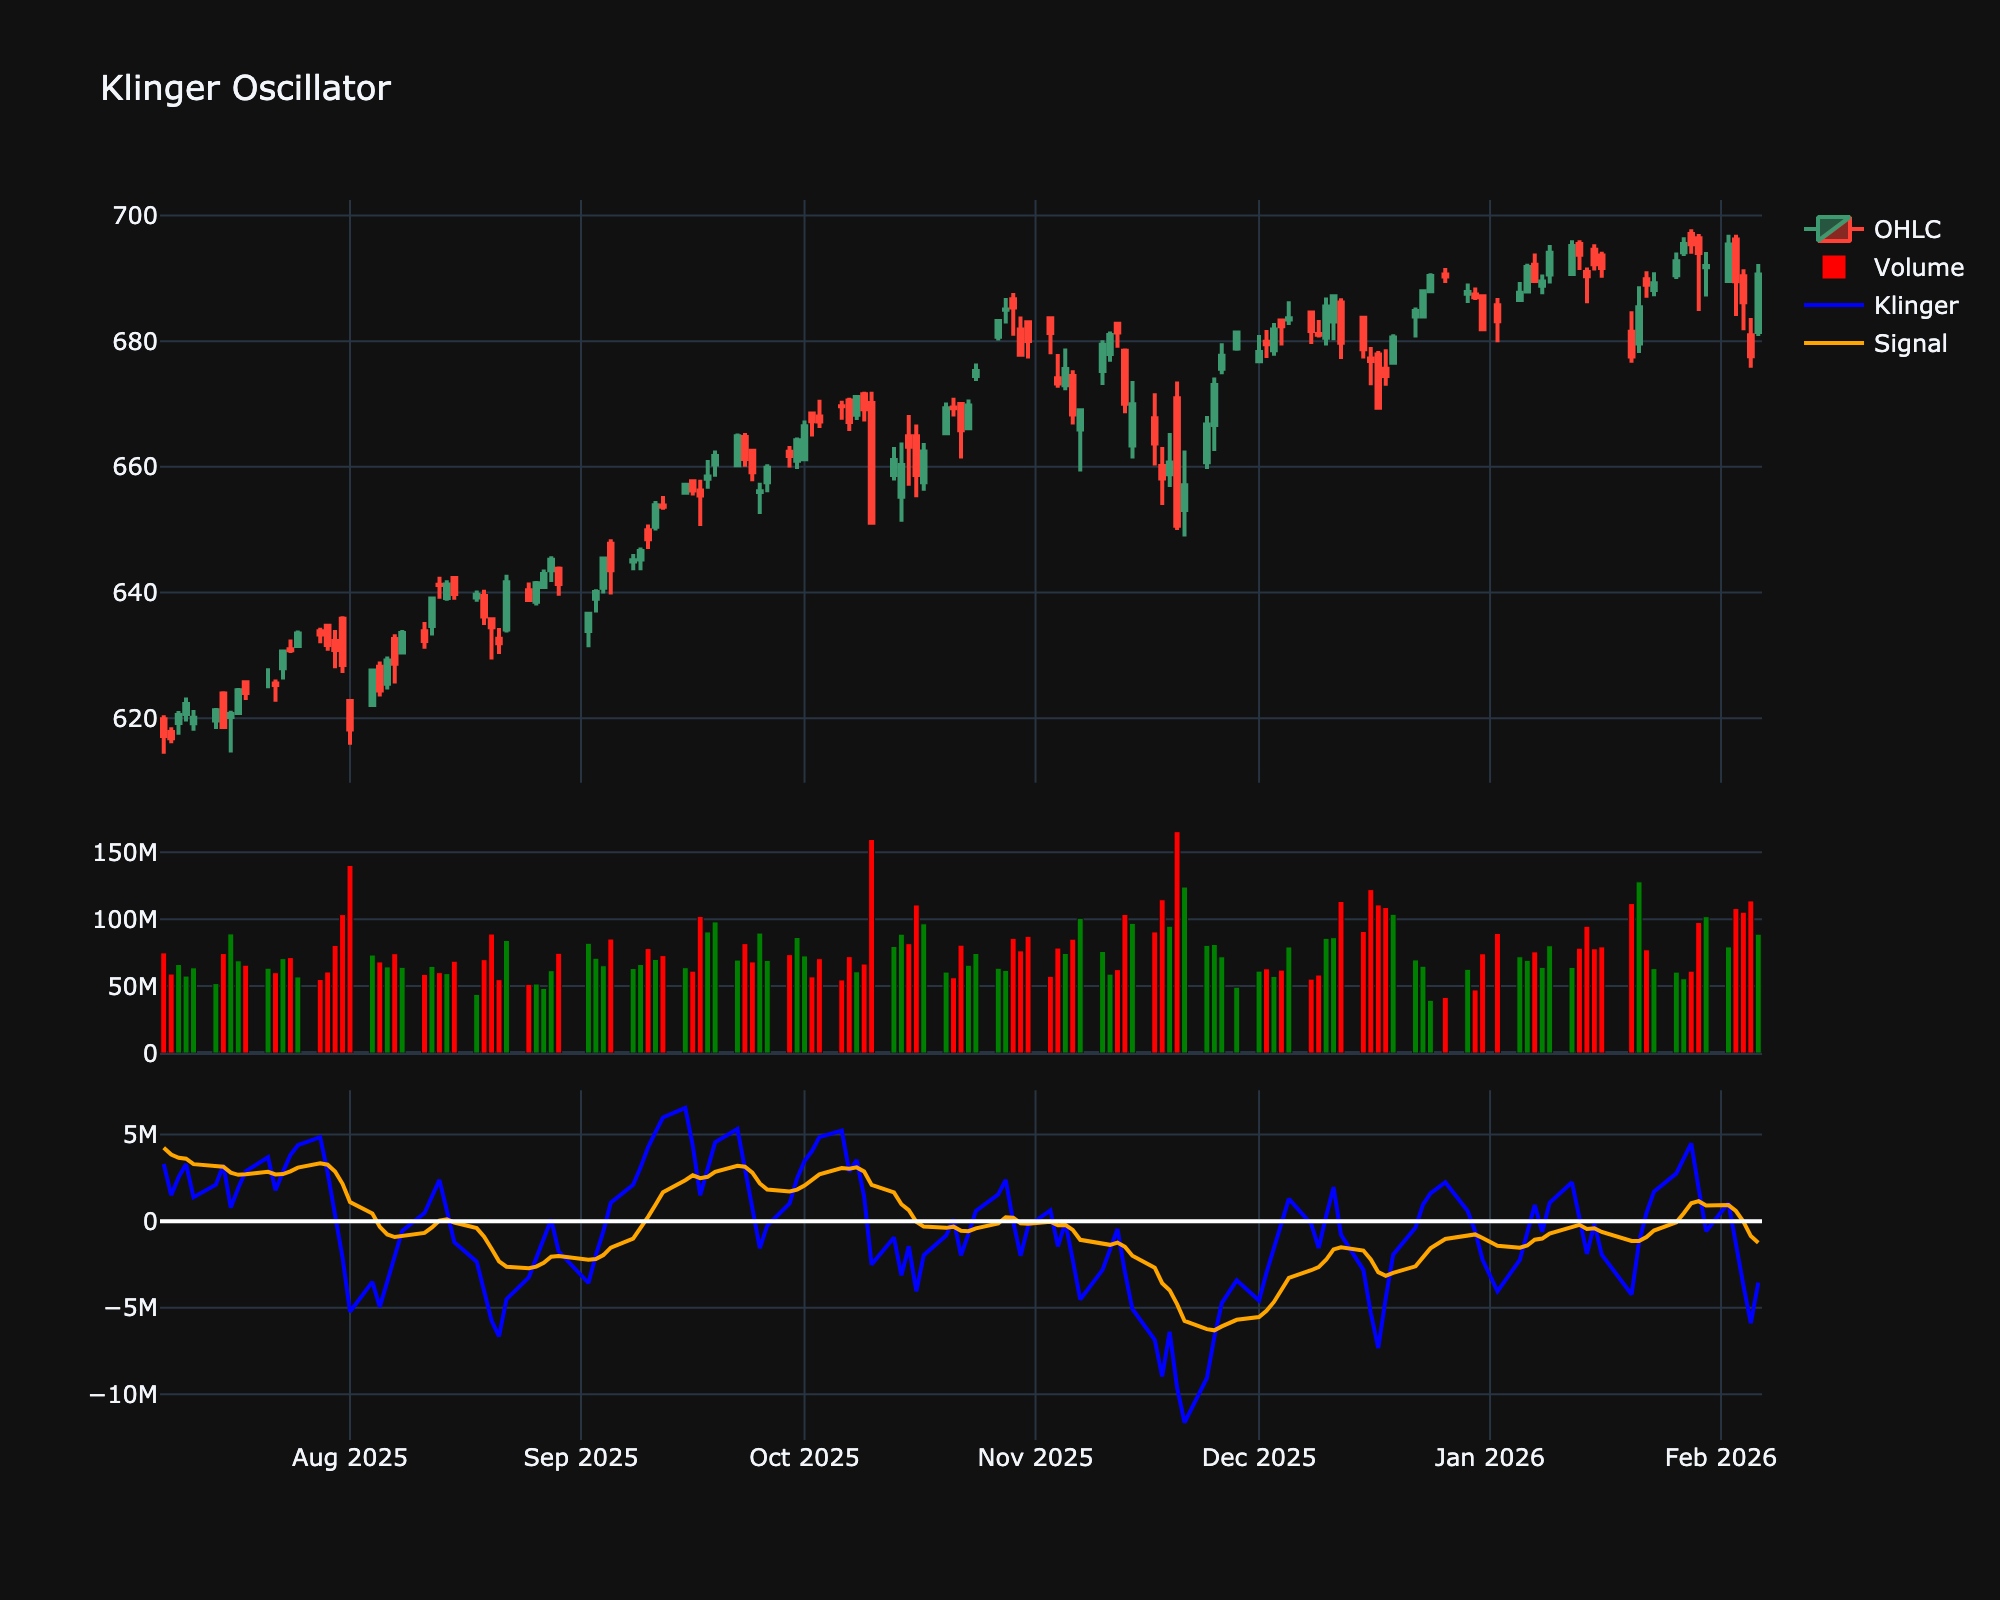
Trading Significance
-
Signal Line Crossover:
-
Buy: KO crosses above the Signal Line.
-
Sell: KO crosses below the Signal Line.
-
-
Divergence: Divergence between price and volume is a key signal. For example, if price is rising but the KO is falling, it suggests the uptrend is losing volume support.
-
Zero Line: Crossovers of the zero line indicate a shift in the long-term money flow trend.