Money Flow Index (MFI)
| Name | Type | Prerequisite | Use Cases |
|---|---|---|---|
| Money Flow Index (MFI) | Volume/Momentum | OHLC Data | Spotting reversals when volume and price are out of sync. |
Definition
The Money Flow Index (MFI) is a technical oscillator that uses price and volume data for identifying overbought or oversold signals in an asset. It can also be used to spot divergences which warn of a trend change in price.
Mathematical Equation
\[
\text{Typical Price} = \frac{\text{High} + \text{Low} + \text{Close}}{3}
\]
\[
\text{Raw Money Flow} = \text{Typical Price} \times \text{Volume}
\]
\[
\text{Money Flow Ratio} = \frac{\text{14-period Positive Money Flow}}{\text{14-period Negative Money Flow}}
\]
\[
MFI = 100 - \frac{100}{1 + \text{Money Flow Ratio}}
\]
Special cases
- Maximum possible value: 100
- Minimum possible value: 0
- Behavior: Oscillates between 0 and 100. It is a volume-weighted version of RSI.
Visualization
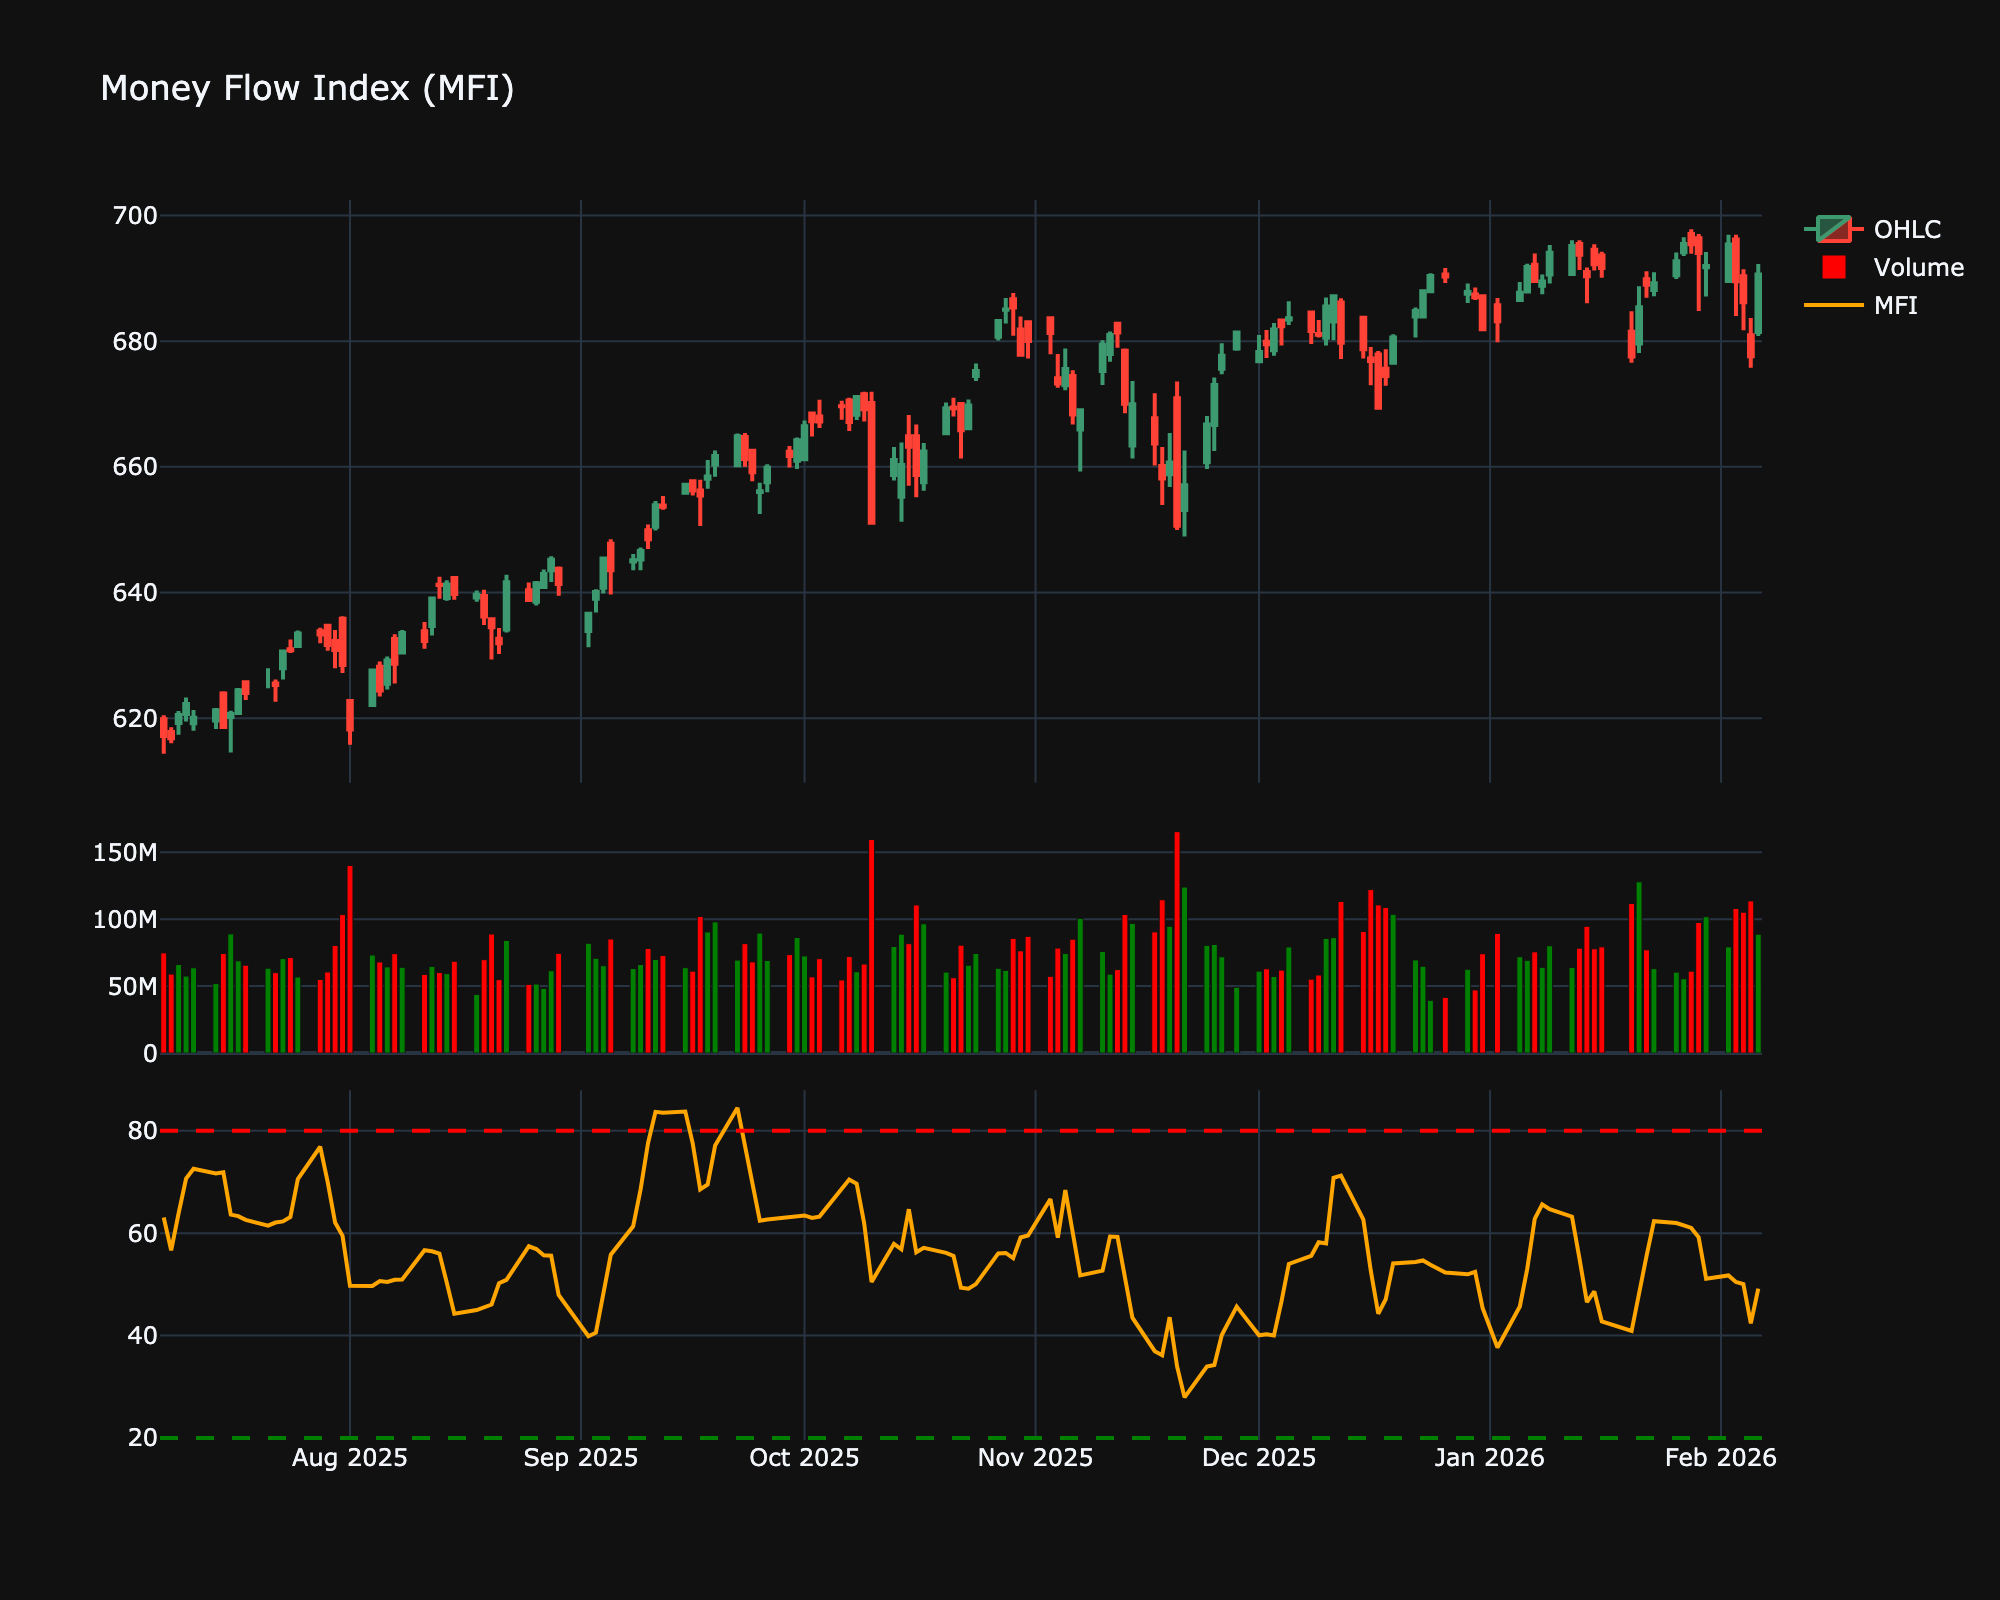
Trading Significance
-
Overbought/Oversold: MFI > 80 is overbought, < 20 is oversold.
-
Divergence: Price making new highs but MFI failing to surpass 80 signals a reversal.