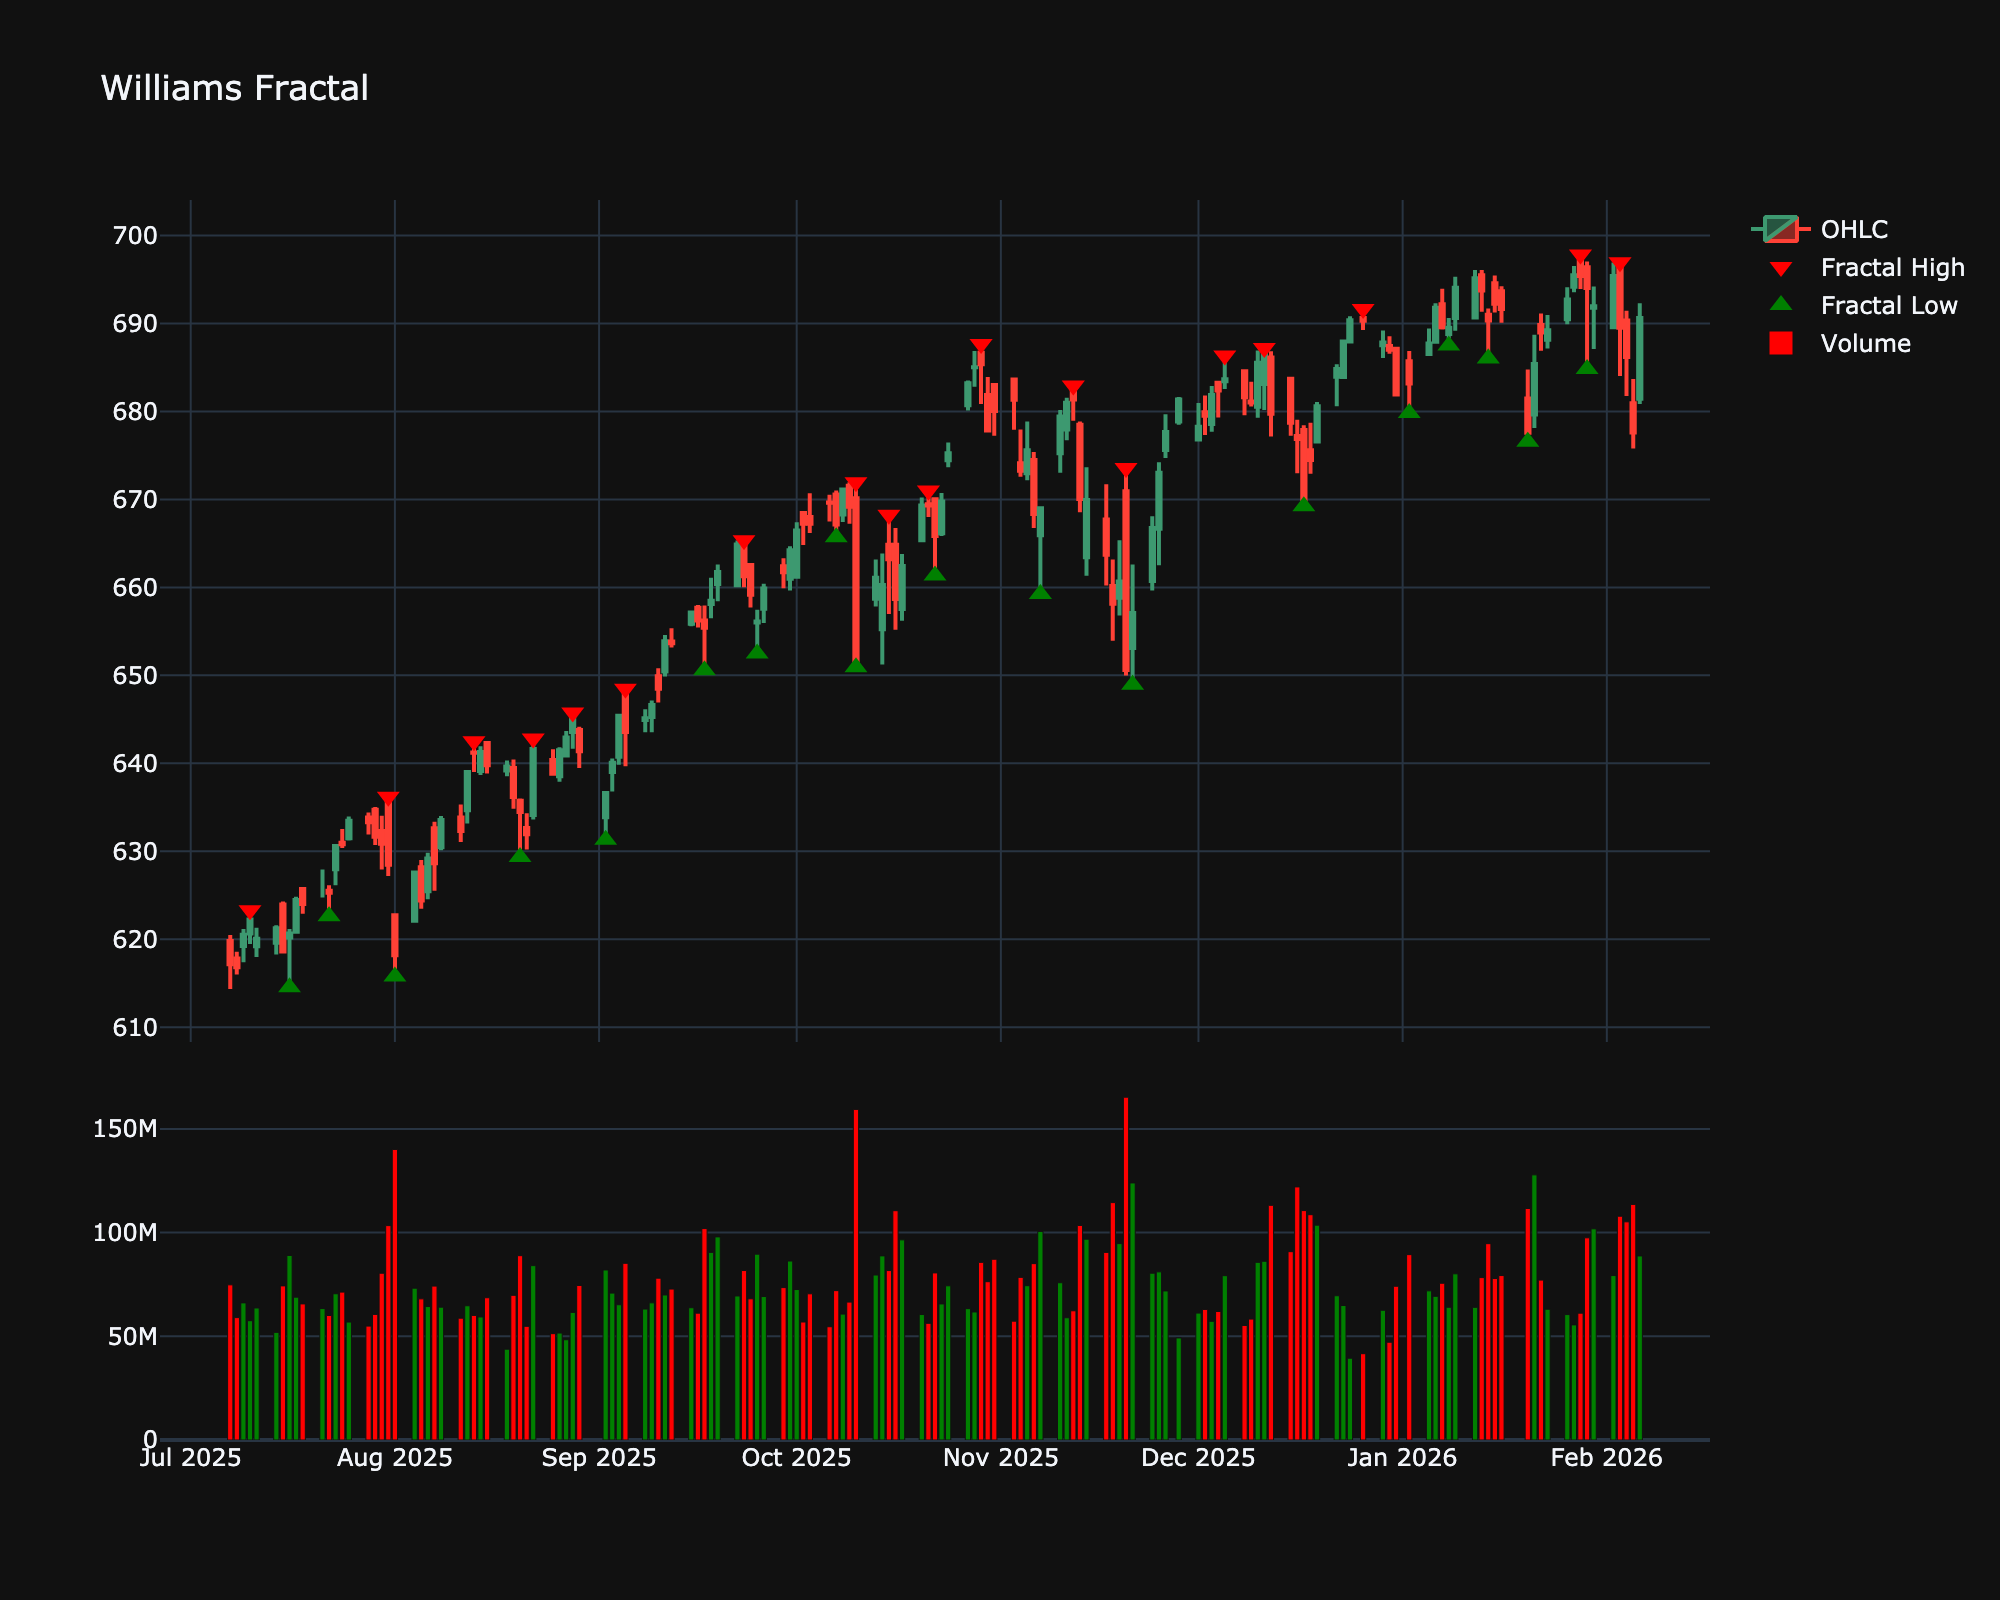
Williams Fractal
| Name | Type | Prerequisite | Use Cases |
|---|---|---|---|
| Williams Fractal (FRAC) | Structure | OHLC Data | Defines support and resistance levels based on local price reversals. |
Definition
A recurring pattern that predicts reversals. Fractals are indicators on candlestick charts that identify reversal points in the market.
Mathematical Equation
\[\n\text{Bullish Fractal}: L_3 < L_1, L_2, L_4, L_5 \\\n\text{Bearish Fractal}: H_3 > H_1, H_2, H_4, H_5\n\]
Special cases
- Maximum possible value: Price Levels
- Minimum possible value: Price Levels
- Behavior: Highlights specific price points on the chart (local highs and lows).
Visualization
Trading Significance
-
Category: Pattern
-
Use Case: Identifies entry and exit points based on geometric price patterns.