Fisher Transform
| Name | Type | Prerequisite | Use Cases |
|---|---|---|---|
| Fisher Transform (FT) | Momentum | OHLC Data | Pinpointing turning points with extreme clarity. |
Definition
The Fisher Transform is a technical indicator created by John Ehlers that converts prices into a Gaussian normal distribution. The indicator oscillates above and below a zero line, providing clear turning points and helping to identify trend reversals. Its sharp turning points are often superior to other oscillators for timing entries and exits.
Mathematical Equation
First, calculate the midpoint price and normalize it to a range of -1 to 1 over \(N\) periods. Let this be \(x\).
The value \(y\) is then typically smoothed to produce the final Fisher Transform line. A signal line (often the previous value of the Fisher line) is plotted for crossovers.
Special cases
- Maximum possible value: Unbounded
- Minimum possible value: Unbounded
- Behavior: Oscillates around zero with sharp turning points, converting prices into a Gaussian normal distribution.
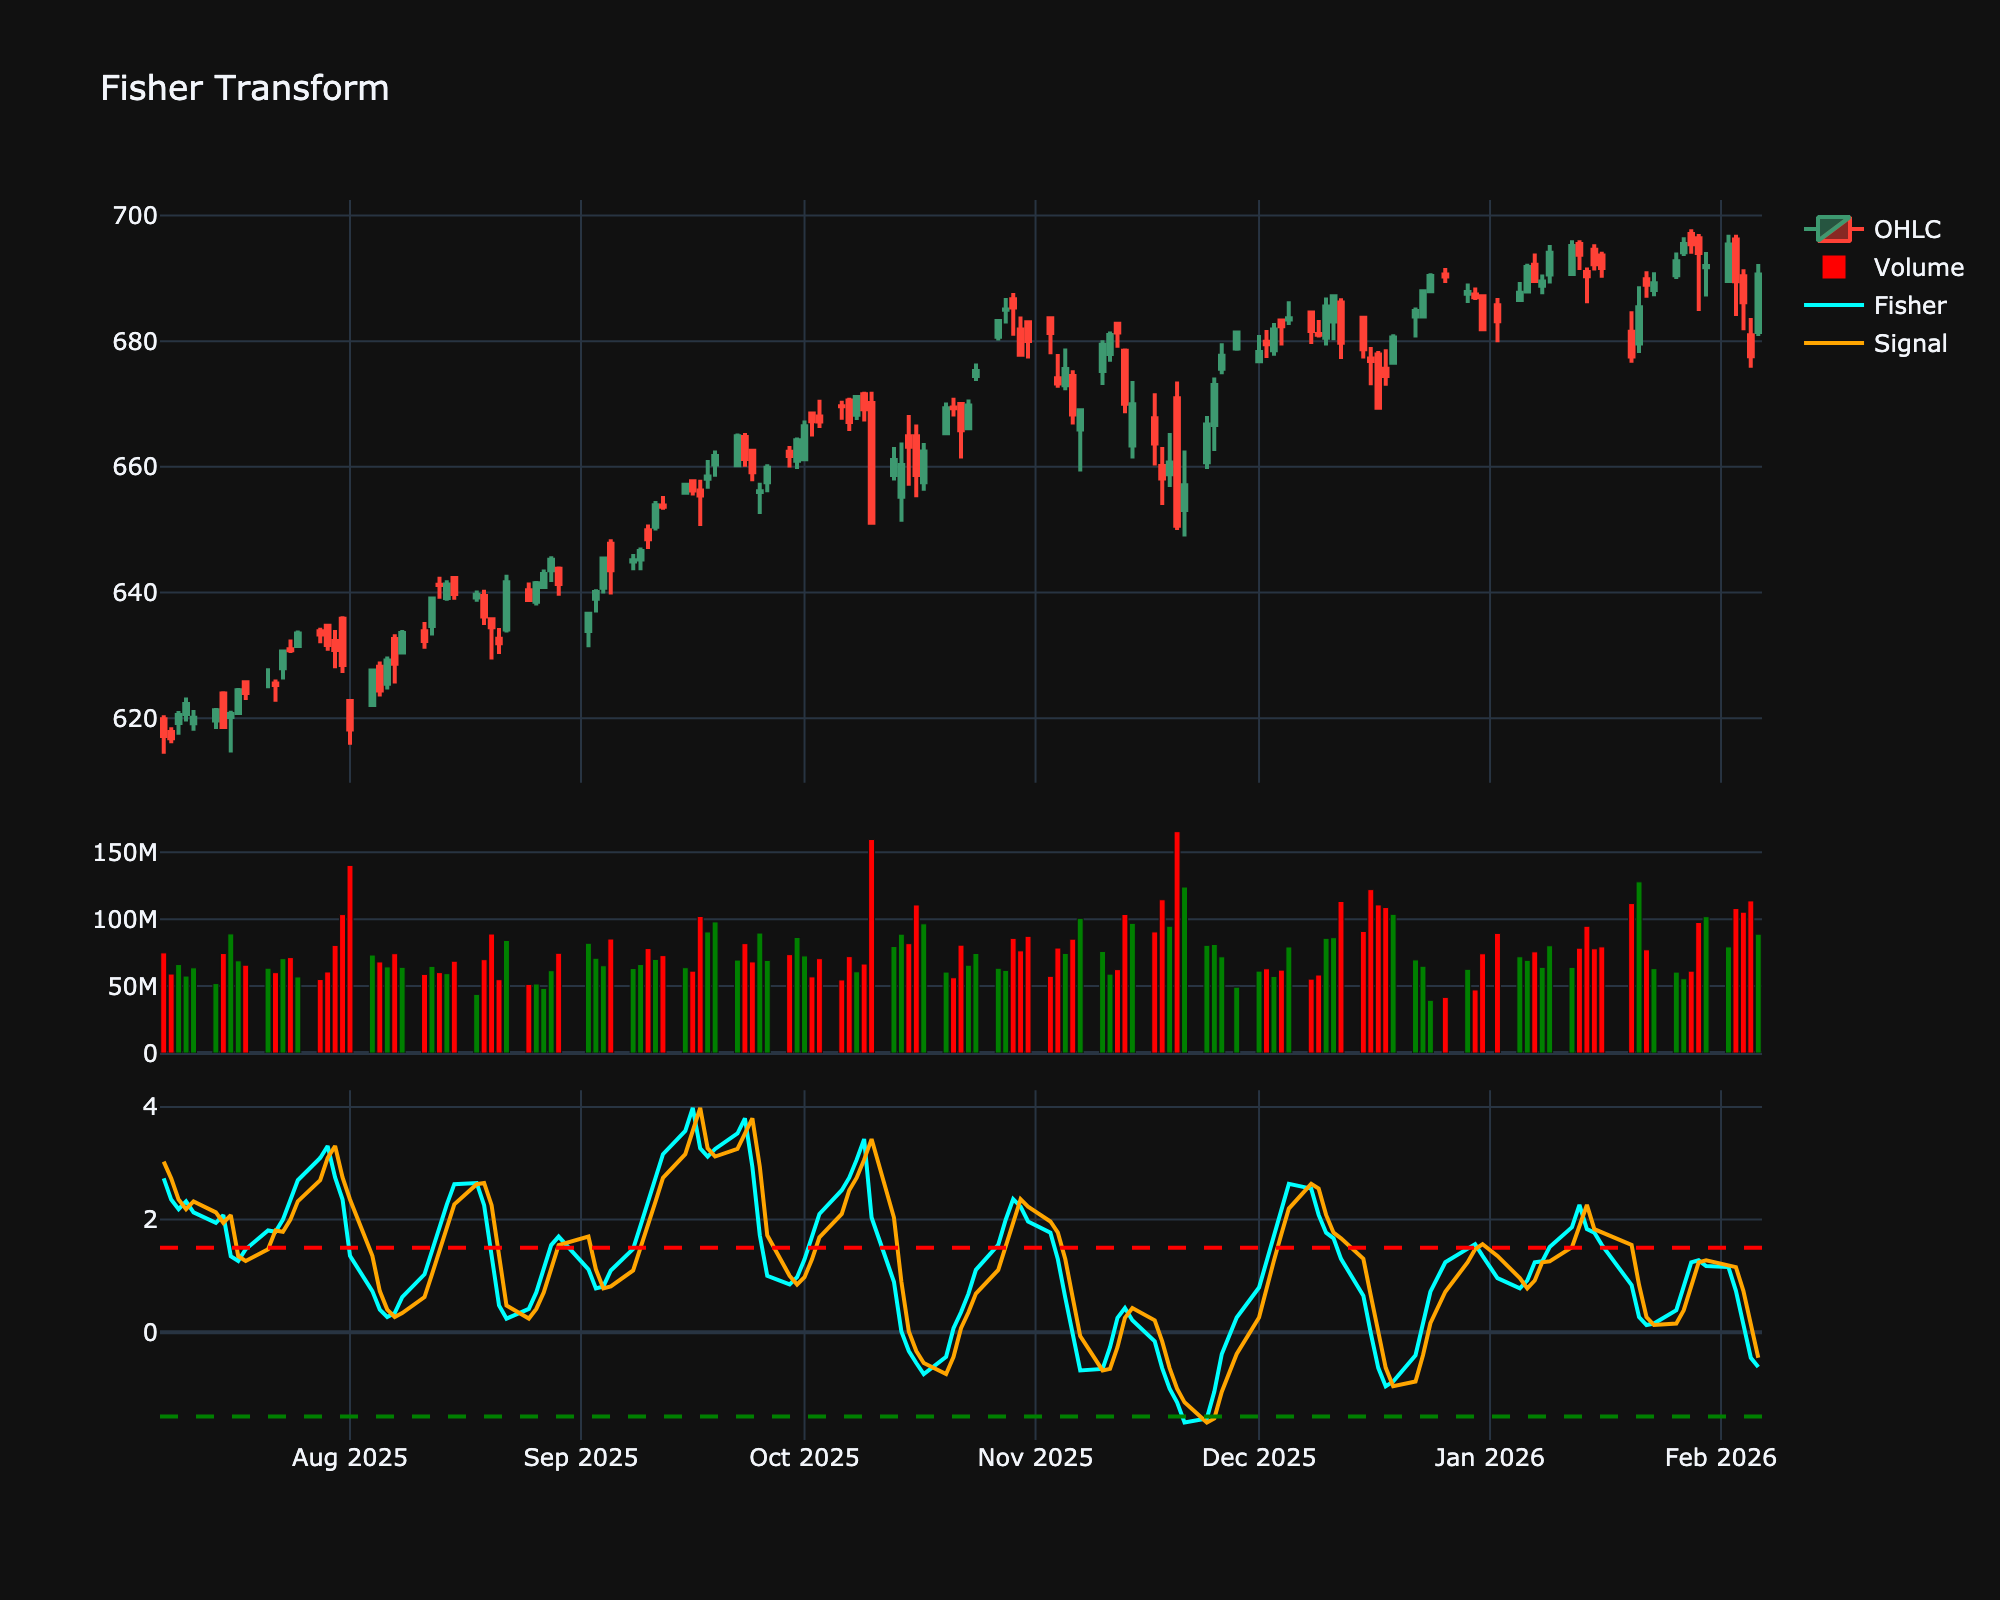
Visualization
Trading Significance
-
Reversals: The Fisher Transform produces sharp peaks and troughs. An extreme reading followed by a reversal is a strong signal that the price trend may change.
-
Crossovers:
-
Buy: Trigger line crosses above the signal line (or crosses zero from below).
-
Sell: Trigger line crosses below the signal line (or crosses zero from above).
-
-
Extremes: Values beyond standard deviations (e.g., > 1.5 or < -1.5) indicate potential overbought or oversold conditions.