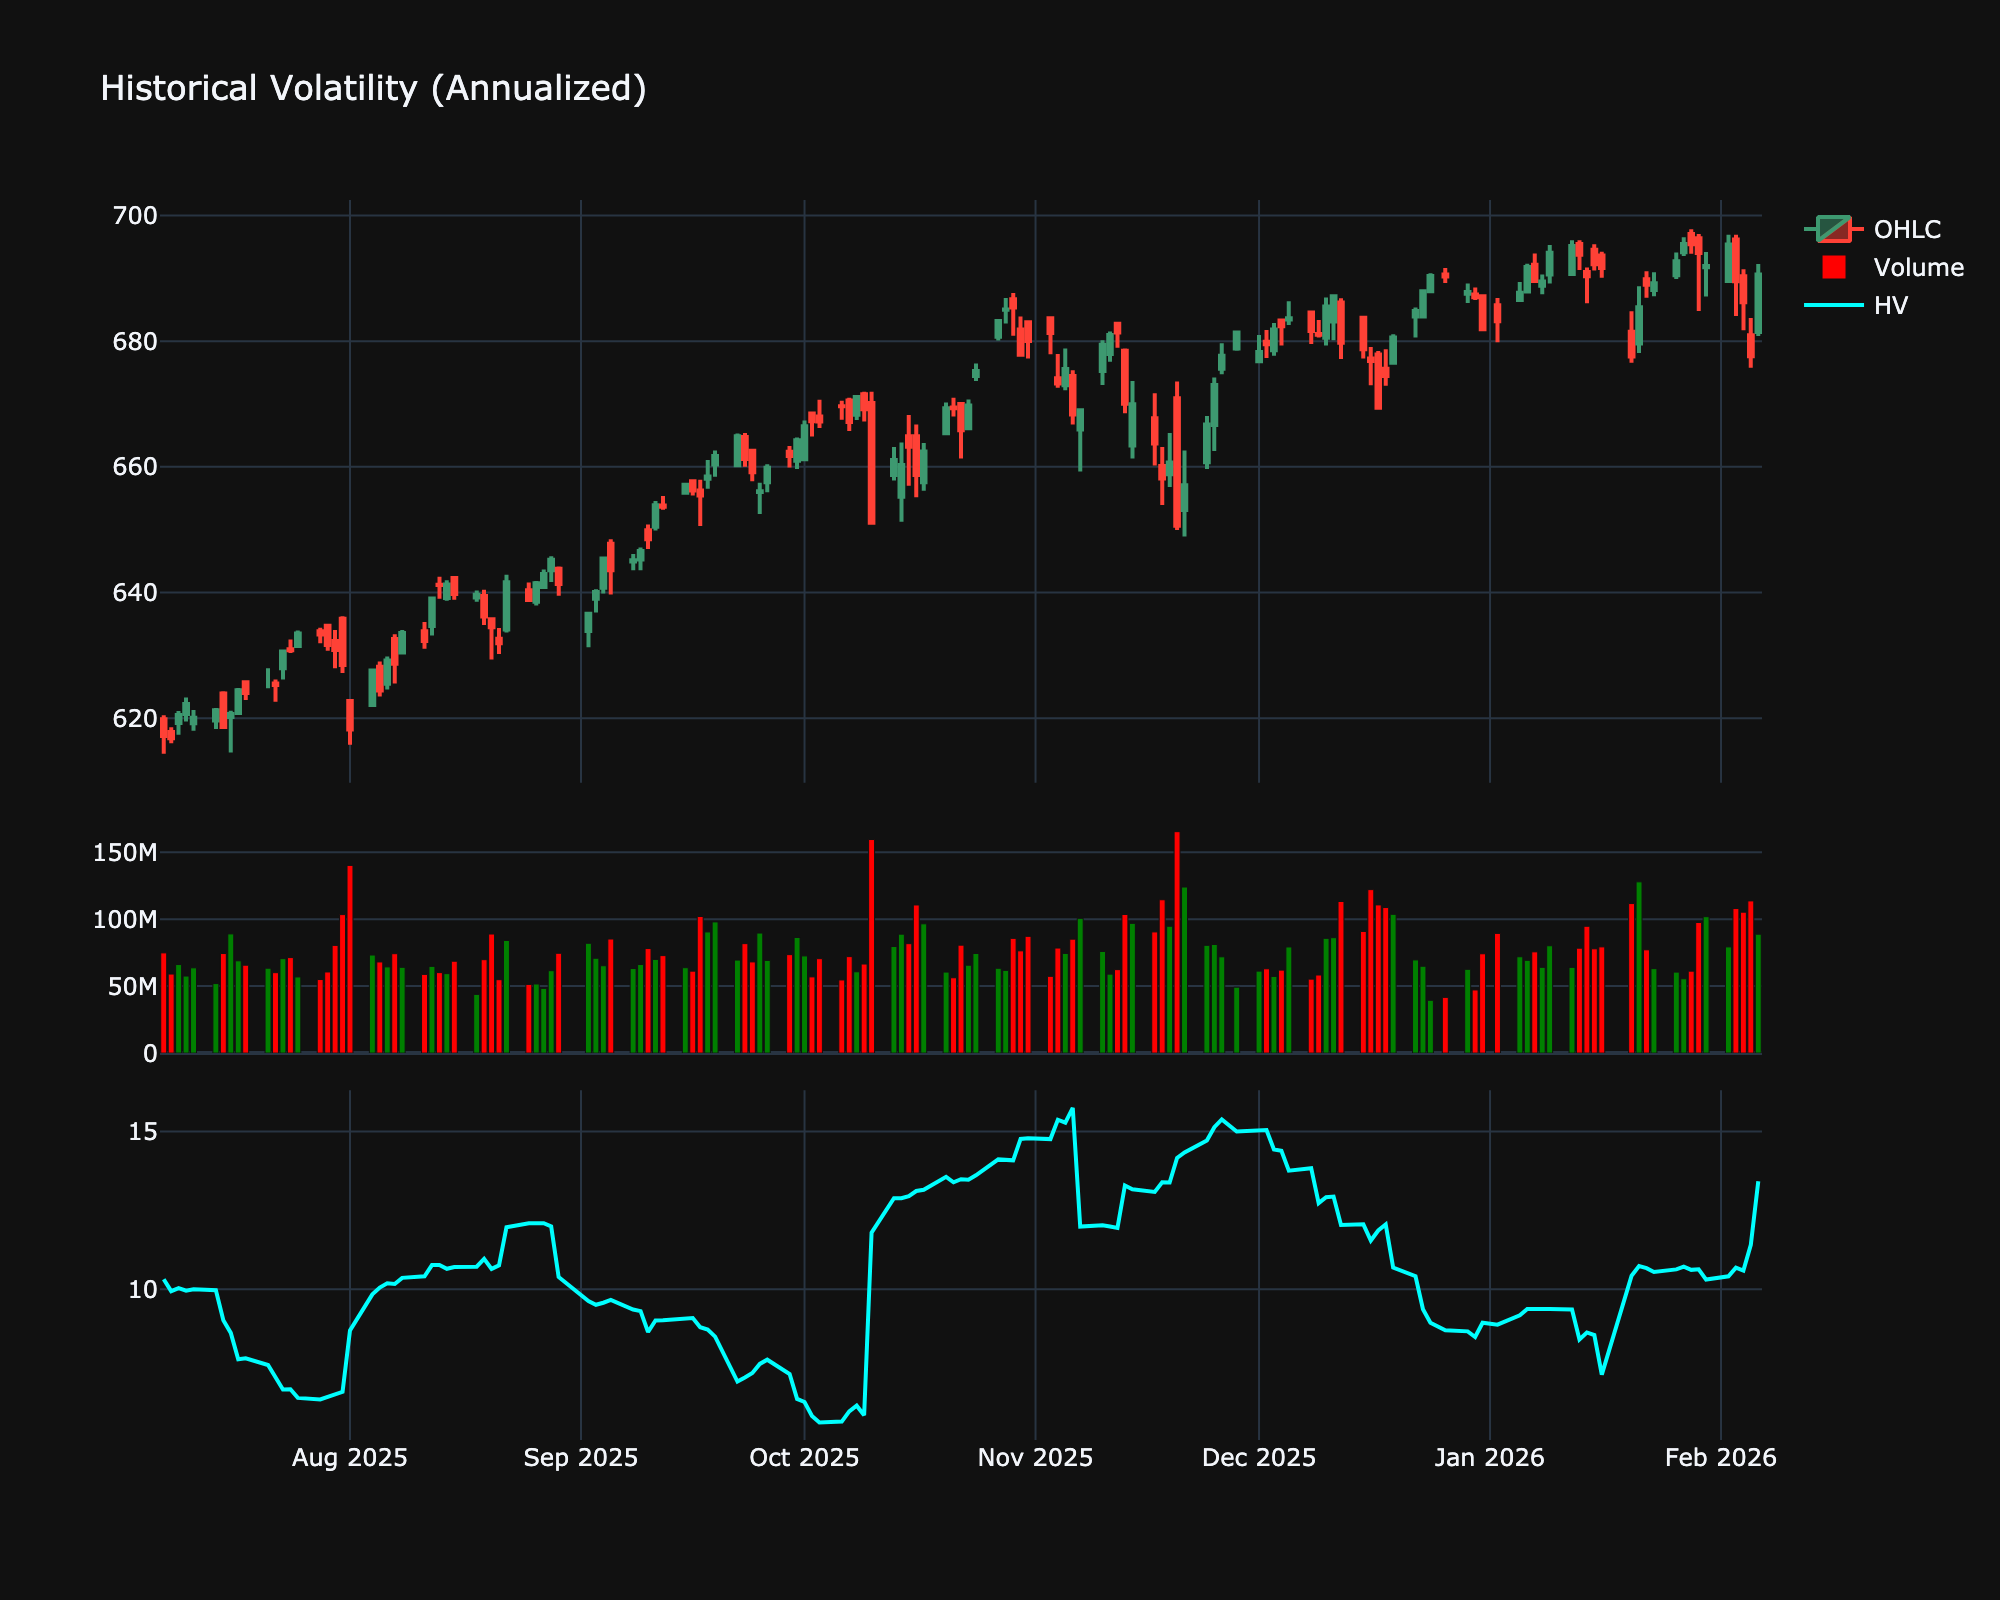
Historical Volatility
| Name | Type | Prerequisite | Use Cases |
|---|---|---|---|
| Historical Volatility (HV) | Volatility | StdDev | Assesses the historical risk profile and prices options. |
Definition
Historical Volatility (HV) is a statistical measure of the dispersion of returns for a given security or market index over a given period of time. Generally, this measure is calculated by determining the standard deviation of the logarithmic returns.
Mathematical Equation
-
Calculate Log Returns: \(r_t = \ln(P_t / P_{t-1})\).
-
Calculate Standard Deviation of \(r\) over \(N\) periods: \(\sigma\).
-
Annualize: \(HV = \sigma \times \sqrt{252} \times 100\).
Special cases
- Maximum possible value: Unbounded
- Minimum possible value: 0
- Behavior: Moves independently, measuring the standard deviation of logarithmic returns over a period.
Visualization
Trading Significance
-
Risk Assessment: Higher volatility implies higher risk.
-
Option Pricing: It is a key input in option pricing models like Black-Scholes.
-
Breakout: Low historical volatility often precedes a breakout.