Tweezer Tops
| Name | Type | Prerequisite | Use Cases |
|---|---|---|---|
| Tweezer Tops | Bearish Reversal | OHLC Data | Identifying resistance levels. |
Definition
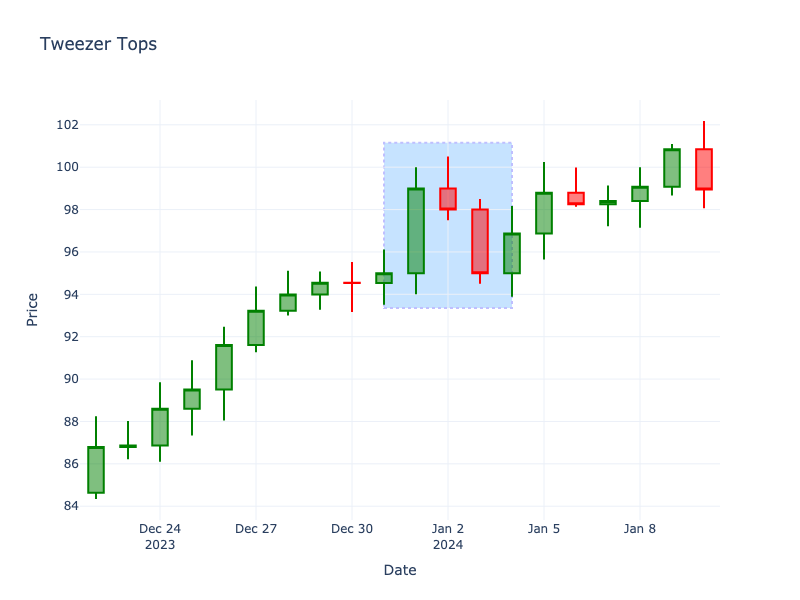
Tweezer Tops form when two or more candlesticks have the same (or very similar) high price. They indicate a firm resistance level that buyers cannot push above.
Pattern Structure
- Context: Uptrend.
- Candle 1: Usually a long green candle.
- Candle 2: Retests the exact high of Candle 1.
Visualization
Story
The bulls push the market up to test a new resistance ceiling, but are firmly rejected. In the next session, they gather their strength and attack the exact same high, only to be swatted down again by aggressive sellers at the precise same price level. Striking the same ceiling twice without breaking it proves that the overhead supply is simply too massive to overcome, exhausting the buyers and inviting a reversal.
Trading Significance
- Resistance Confirmation: The market tested the same high twice and failed to break it.
- Double Top: Can be seen as a mini double top pattern.