Accumulation/Distribution Line (ADL)
| Name | Type | Prerequisite | Use Cases |
|---|---|---|---|
| Accumulation/Distribution (A/D) | Volume | OHLC Data | Confirming a trend or spotting potential reversals. |
Definition
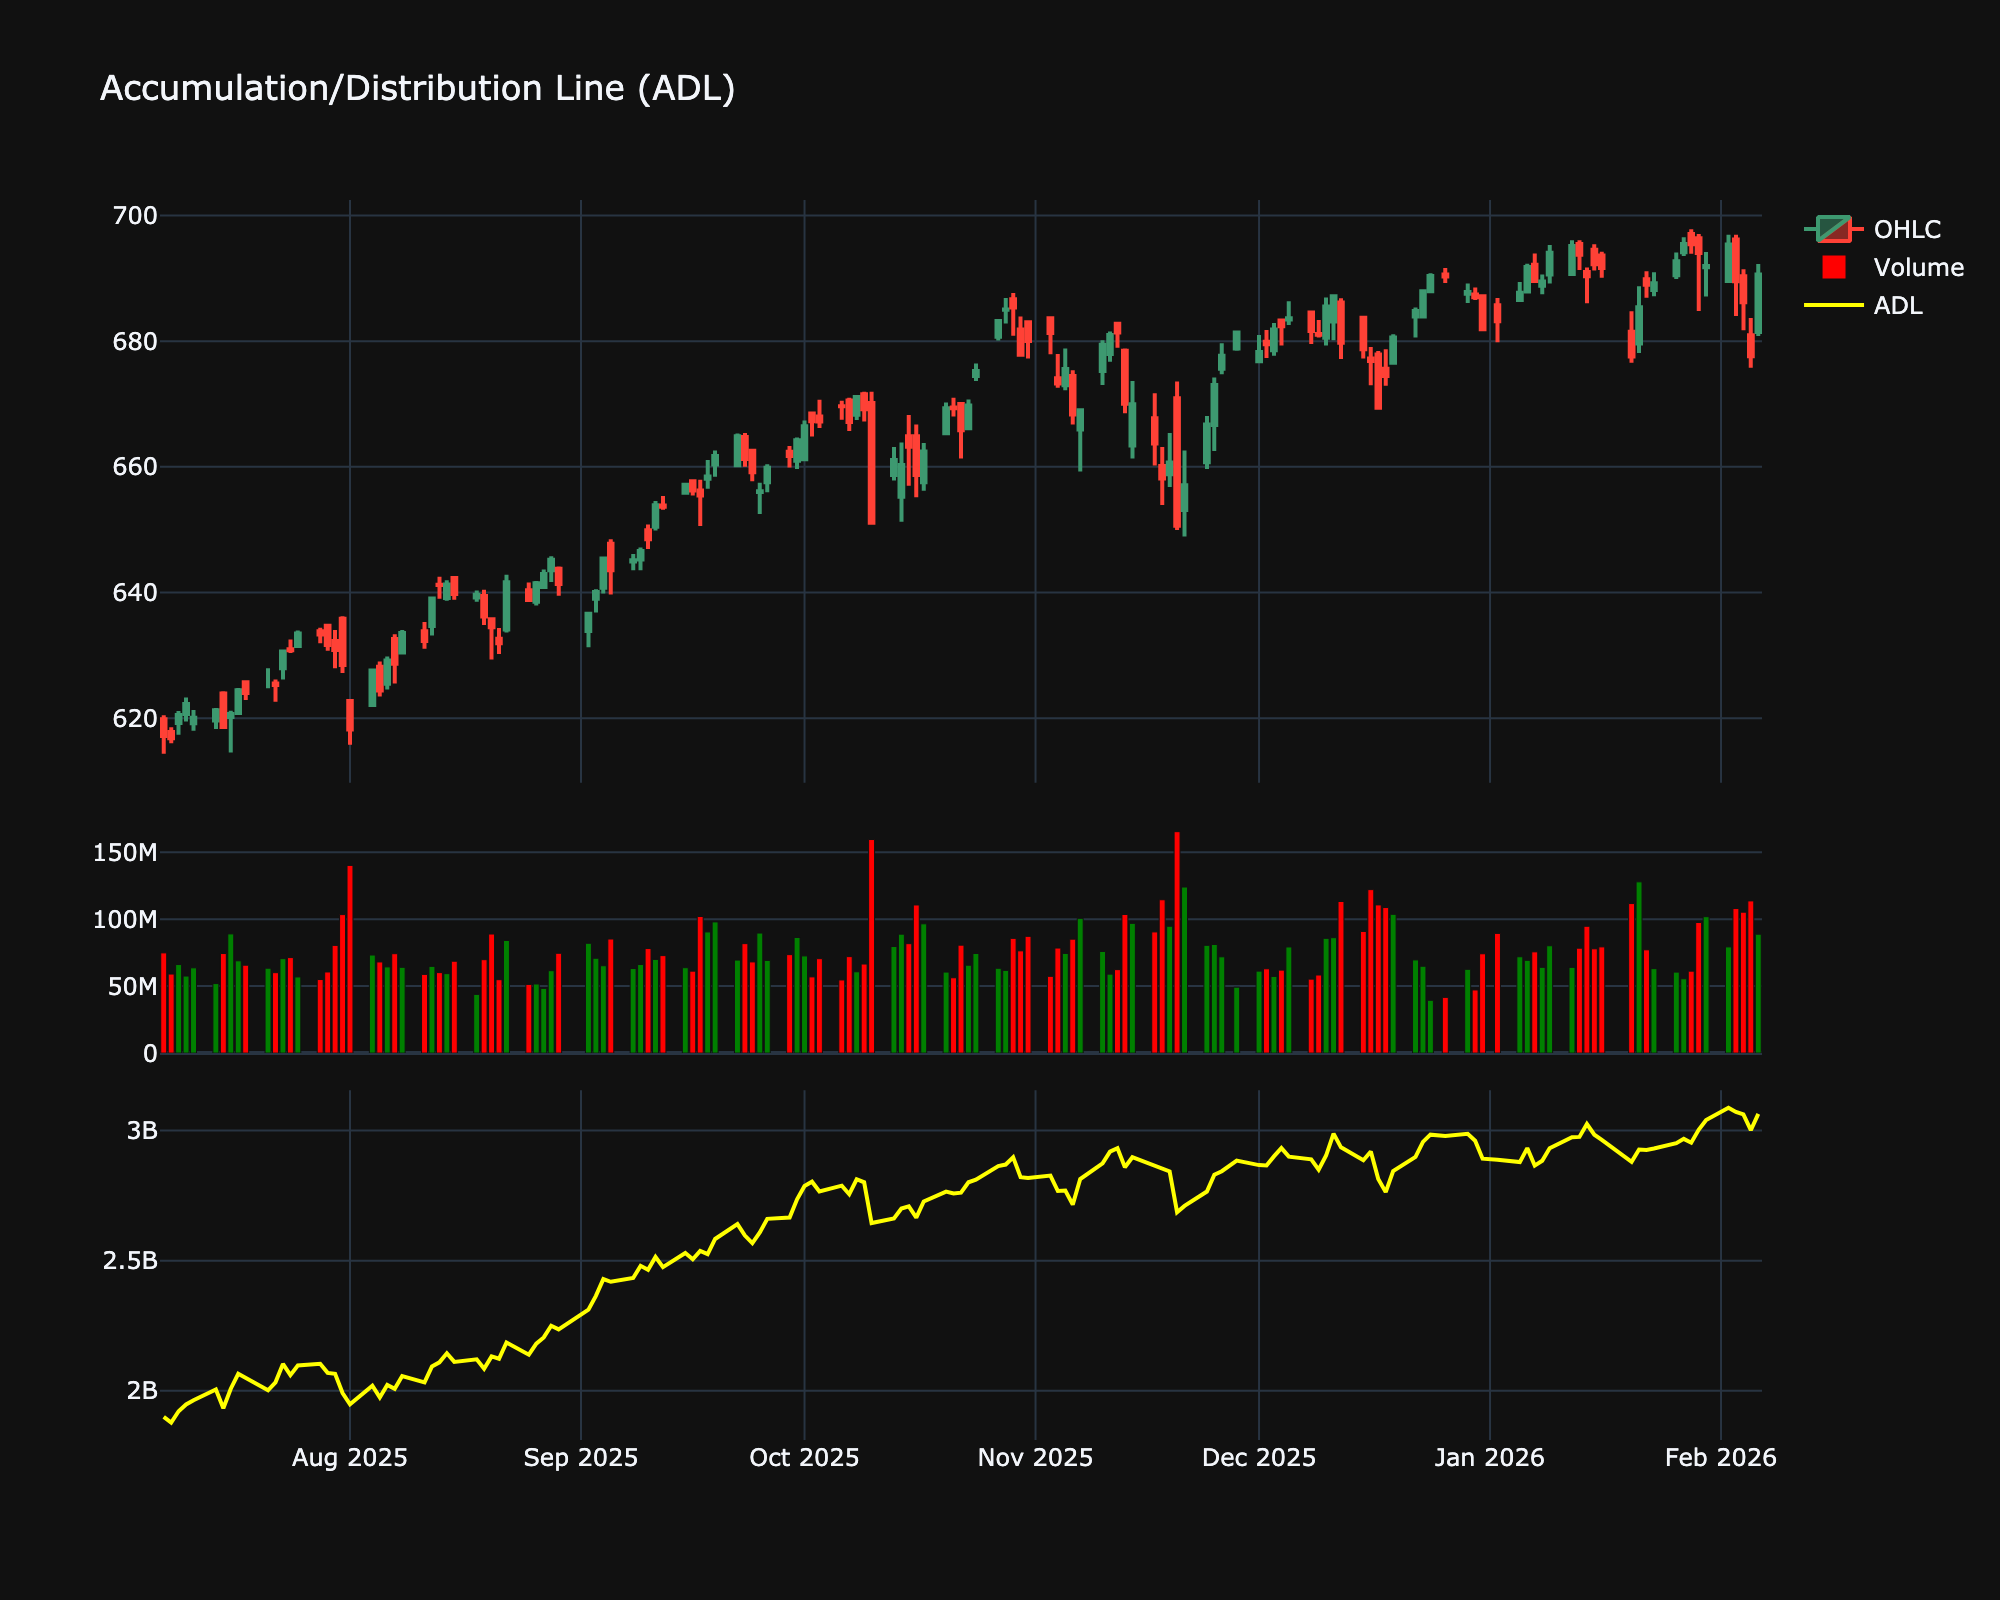
The Accumulation/Distribution Line (ADL) is a cumulative indicator that uses volume and price to assess whether a stock is being accumulated or distributed. The ADL seeks to identify divergences between the stock price and volume flow.
Mathematical Equation
\[
\text{MF Multiplier} = \frac{(Close - Low) - (High - Close)}{High - Low}
\]
\[
\text{MF Volume} = \text{MF Multiplier} \times \text{Volume}
\]
\[
ADL = \text{Previous ADL} + \text{MF Volume}
\]
Special cases
- Maximum possible value: Unbounded
- Minimum possible value: Unbounded
- Behavior: A cumulative line that rises and falls independently, tracking volume and price to assess buying/selling pressure.
Visualization
Trading Significance
-
Trend Confirmation: If the ADL is rising along with the price, it confirms the uptrend (buying pressure). If ADL is falling with price, it confirms the downtrend (selling pressure).
-
Divergence:
-
Bullish Divergence: Price makes a lower low, but ADL makes a higher low. This suggests selling pressure is waning and a reversal may be imminent.
-
Bearish Divergence: Price makes a higher high, but ADL makes a lower high, suggesting underlying weakness.
-