Chaikin Volatility (CVI)
| Name | Type | Prerequisite | Use Cases |
|---|---|---|---|
| Chaikin Volatility (CV) | Volatility | EMA | Identifying volatility peaks that lead to reversals. |
Definition
Chaikin Volatility (CVI) is an indicator that calculates the volatility of a security by measuring the percent change in the high-low range over a specified period. It was developed by Marc Chaikin. It is different from Average True Range (ATR) because it does not account for gaps.
Mathematical Equation
-
Calculate the High-Low range for each period: \(HL = High - Low\)
-
Calculate an \(N\)-period EMA of the HL range: \(EMA_{HL}\)
-
Calculate the percent change of the EMA over \(M\) periods (usually 10):
Special cases
- Maximum possible value: Unbounded
- Minimum possible value: Unbounded
- Behavior: Moves independently, measuring the expansion/contraction of the spread between high and low prices.
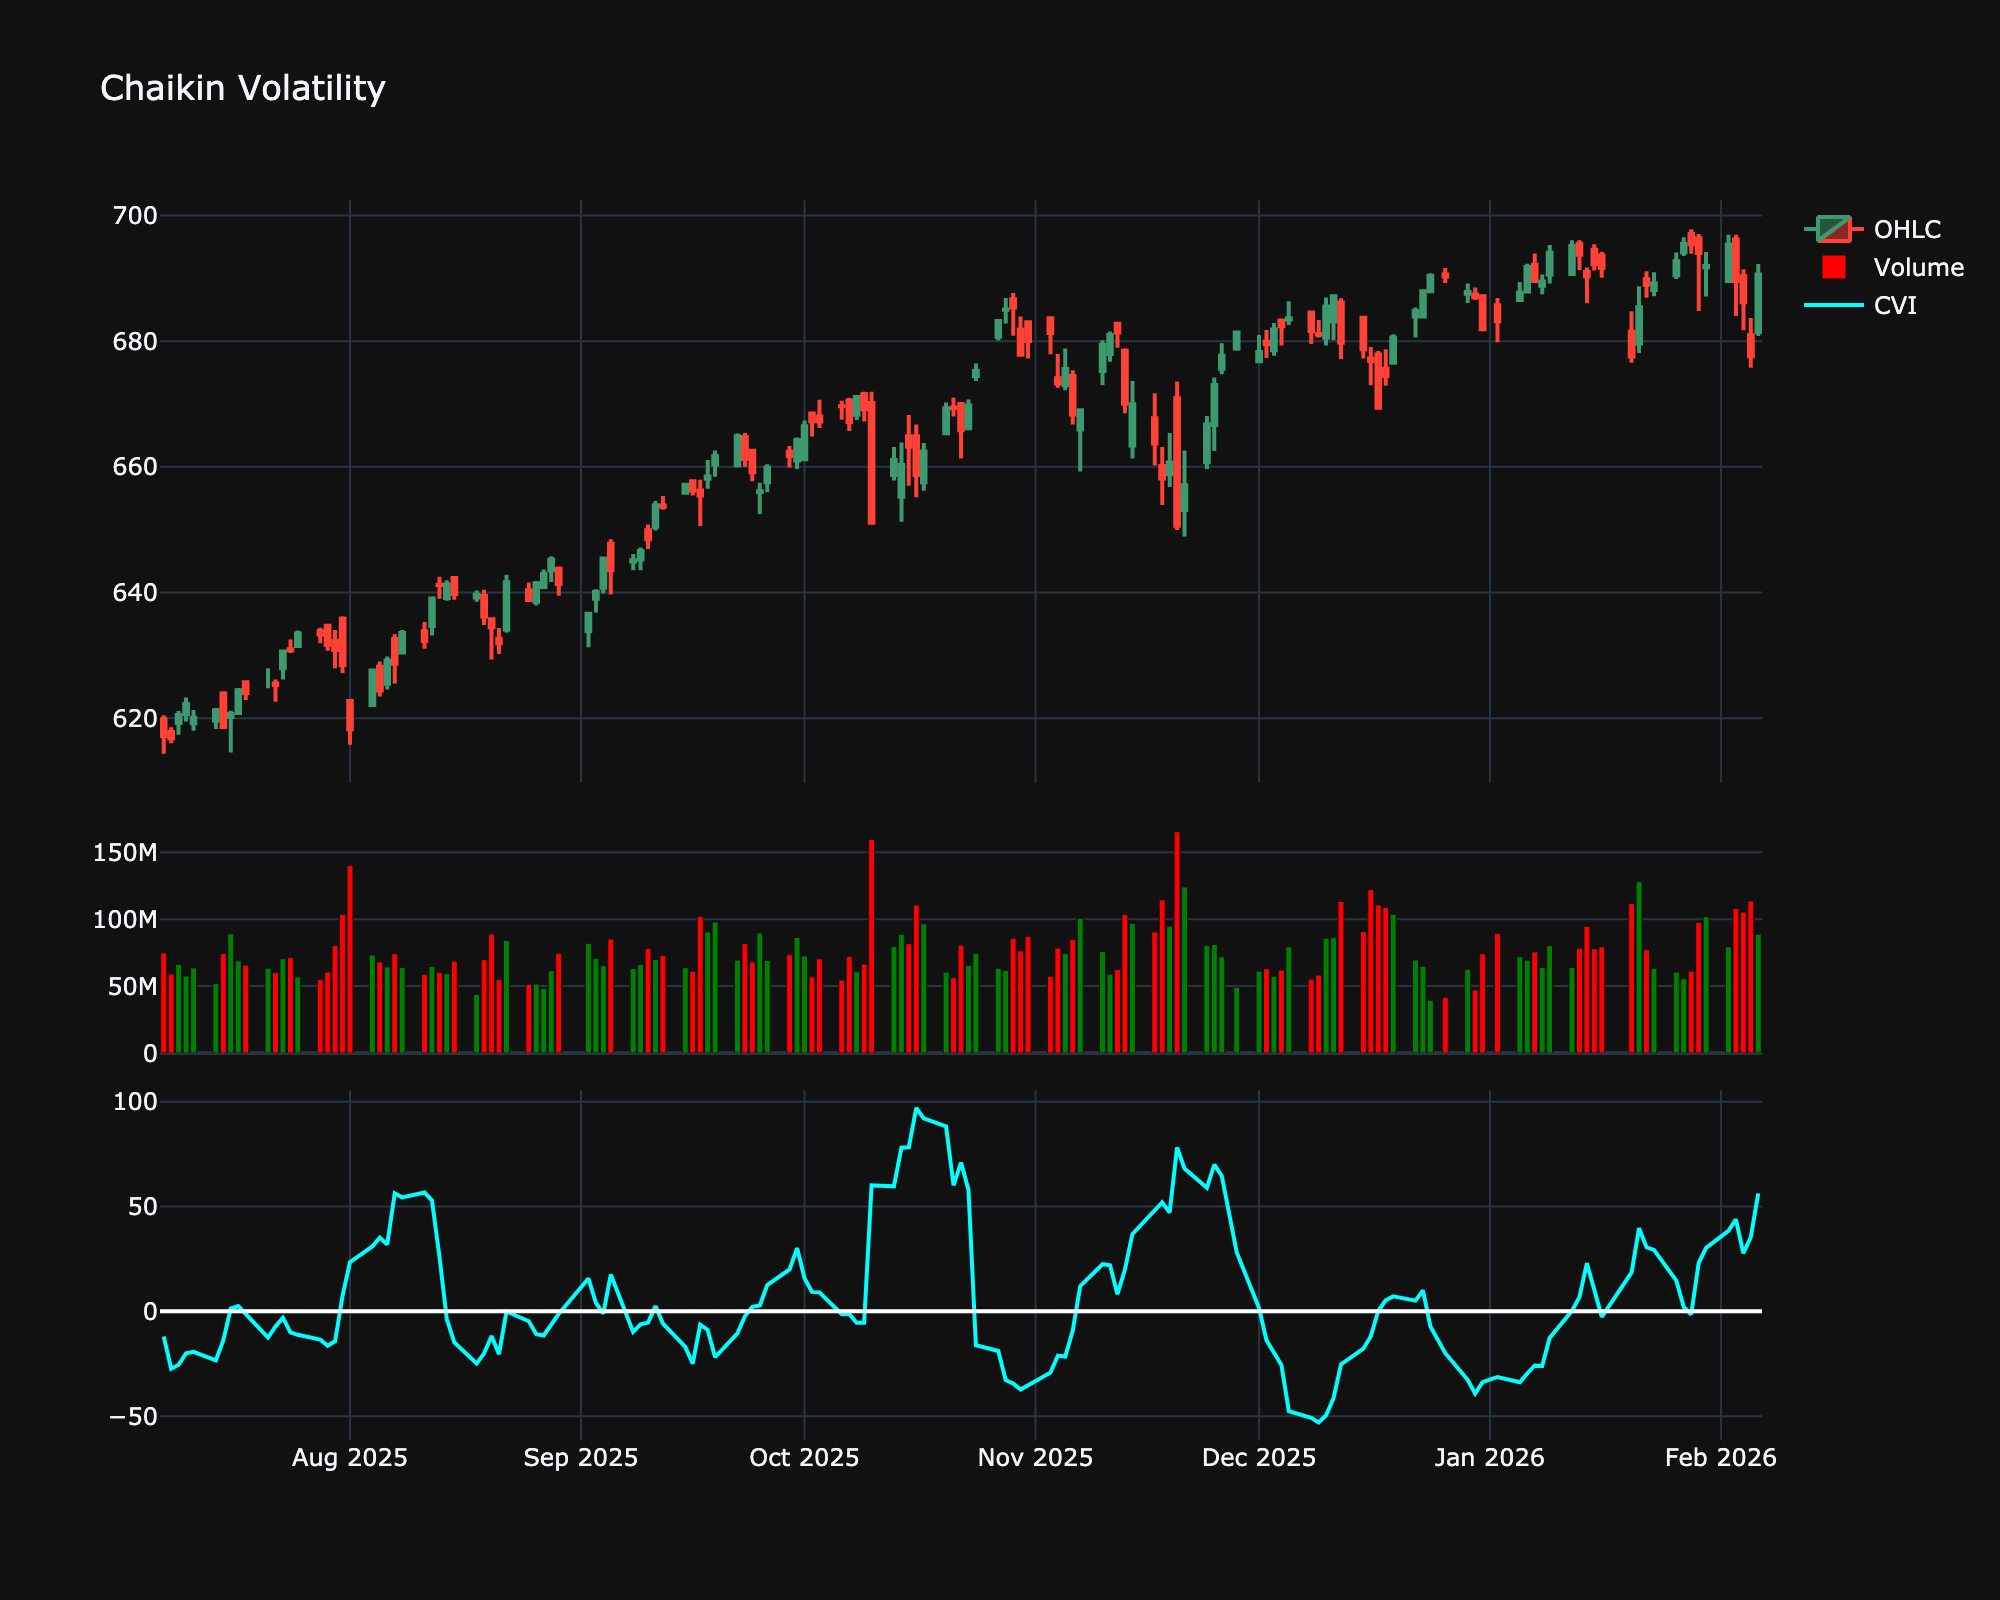
Visualization
Trading Significance
-
Volatility Expansion/Contraction: High values indicate high volatility (expansion), while low values indicate low volatility (contraction).
-
Tops and Bottoms: Sharp increases in volatility often coincide with market tops or bottoms. A rapid decline in volatility may signal a consolidation period.