Net Volume
| Name | Type | Prerequisite | Use Cases |
|---|---|---|---|
| Net Volume (NV) | Volume | Price & Volume | Visualizes net capital flow into or out of an asset. |
Definition
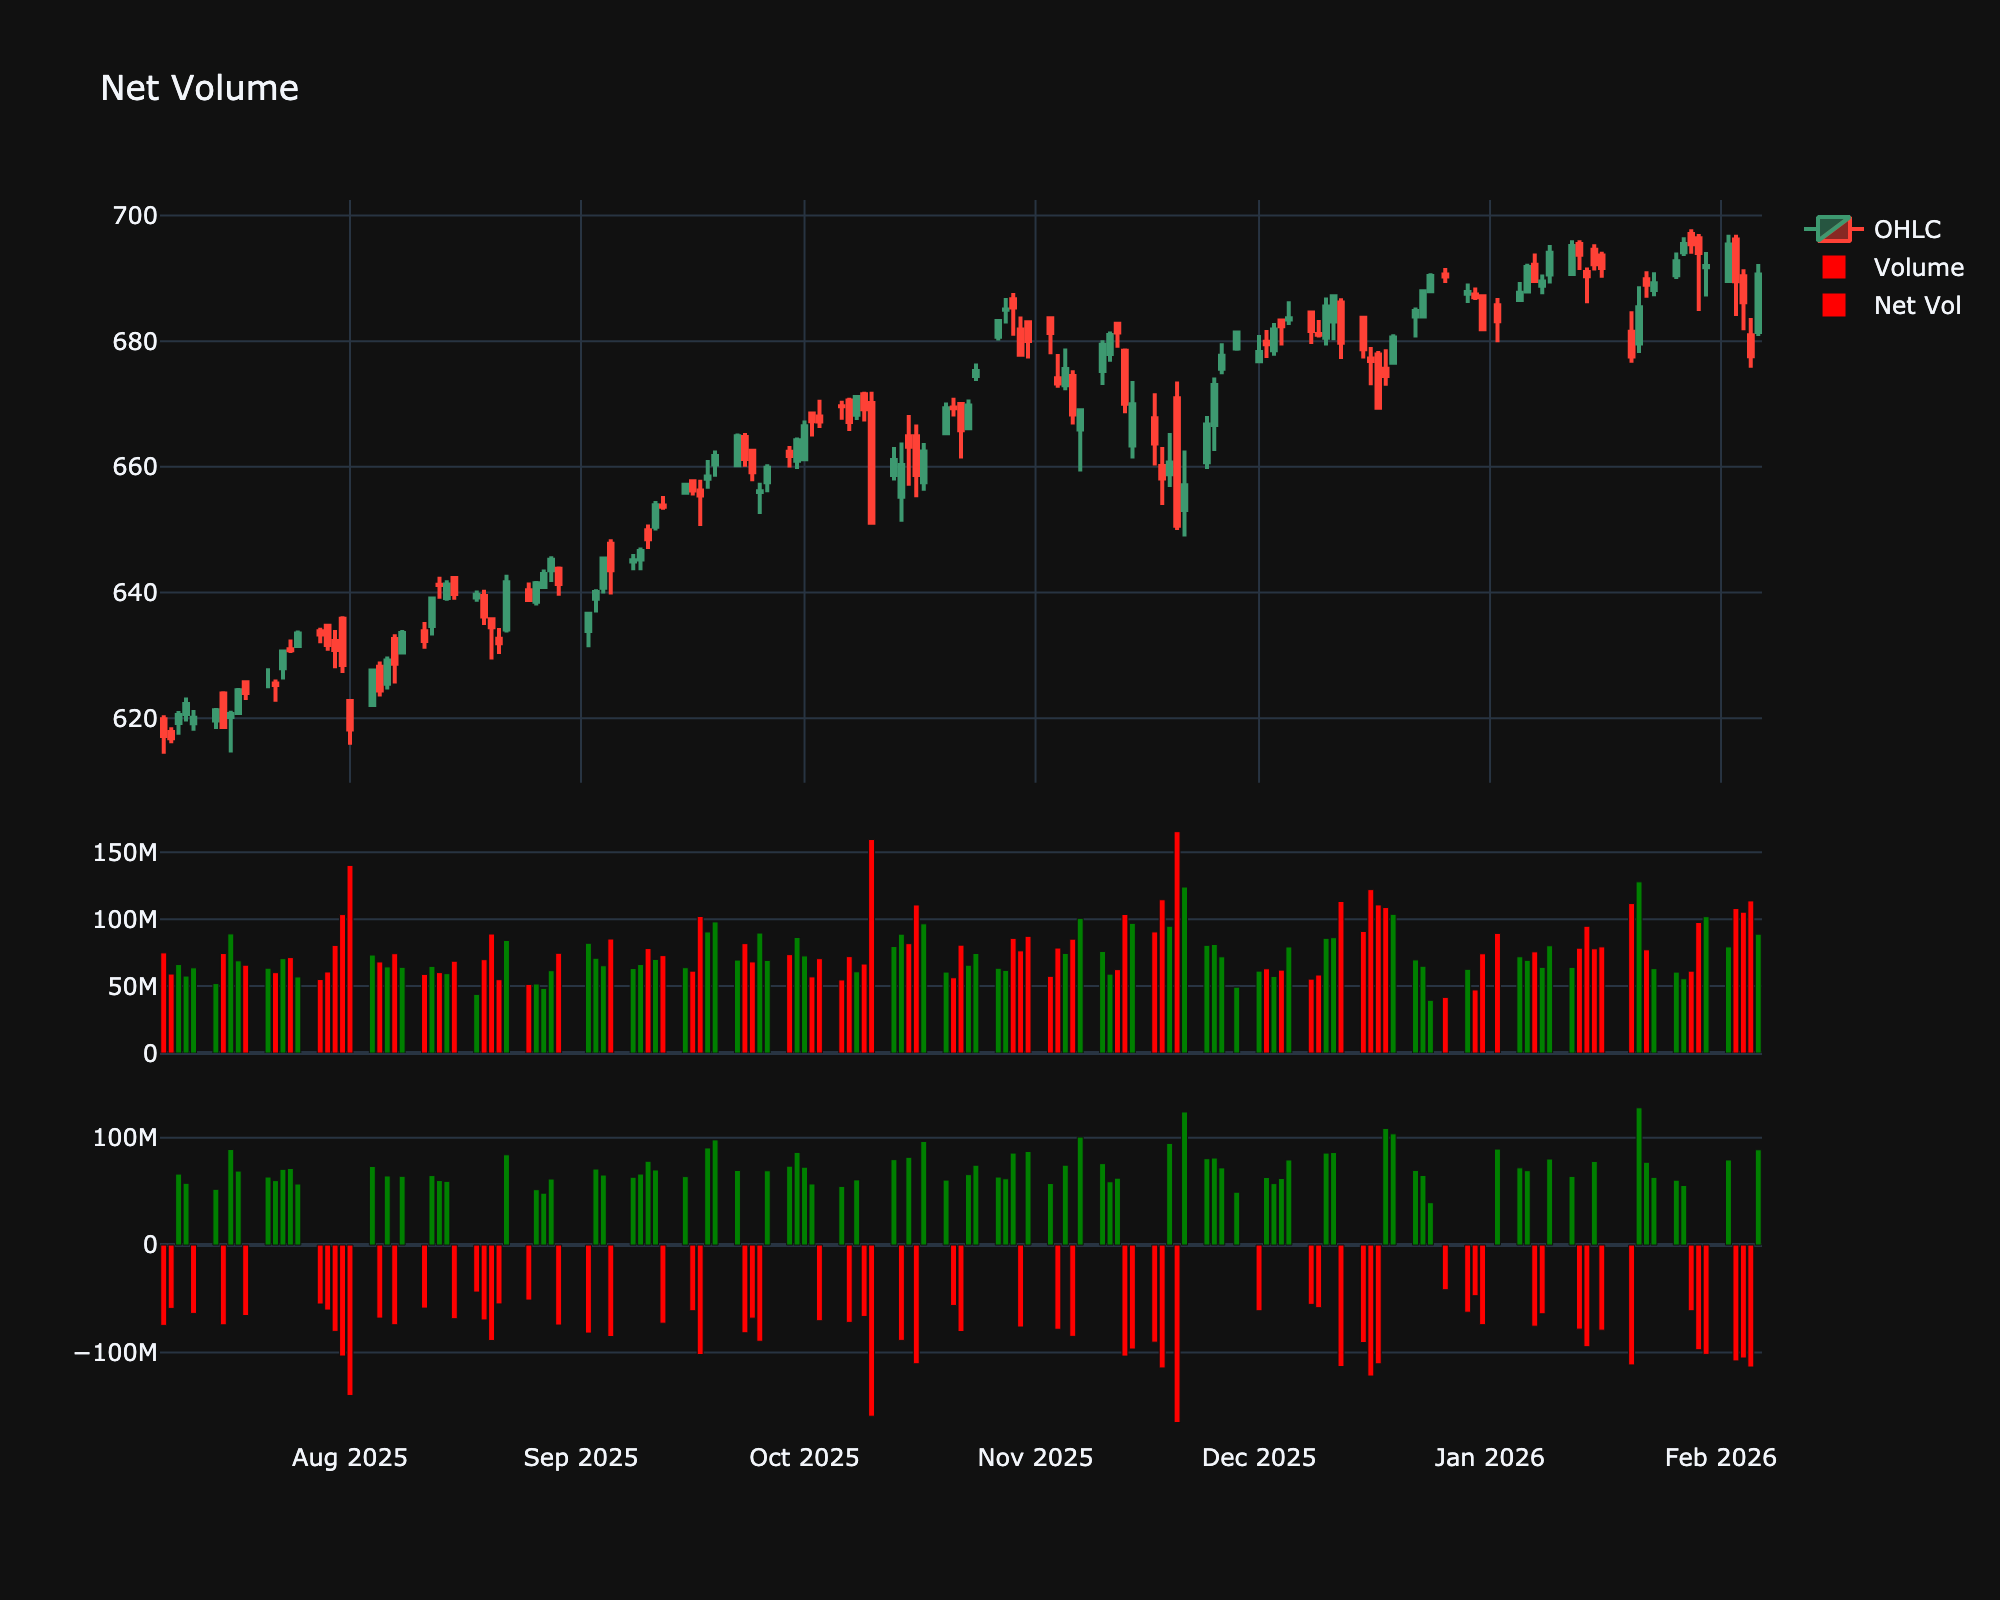
Net Volume is a simple indicator that calculates the net buying or selling pressure for a given period. It is typically calculated by multiplying the volume by the sign of the price change. If the price closes higher, the volume is considered positive; if lower, negative.
Mathematical Equation
\[
\text{Net Volume}_t = Volume_t \times \text{sign}(Close_t - Close_{t-1})
\]
Where:
-
\(\text{sign}(x) = 1\) if \(x > 0\)
-
\(\text{sign}(x) = -1\) if \(x < 0\)
-
\(\text{sign}(x) = 0\) if \(x = 0\)
Special cases
- Maximum possible value: Unbounded
- Minimum possible value: Unbounded
- Behavior: Fluctuates up and down showing the difference between up-volume and down-volume.
Visualization
Trading Significance
-
Buying/Selling Pressure: Positive bars indicate net buying pressure, while negative bars indicate net selling pressure.
-
Volume Spikes: Large spikes in net volume can confirm the strength of a price move or signal a potential reversal (climax).
-
Cumulative: Sometimes plotted cumulatively (like OBV) to show the aggregate flow over time.