Linear Regression Slope
| Name | Type | Prerequisite | Use Cases |
|---|---|---|---|
| Linear Regression Slope (LRS) | Momentum | OHLC Data | Identifying trend strength and potential exhaustion. |
Definition
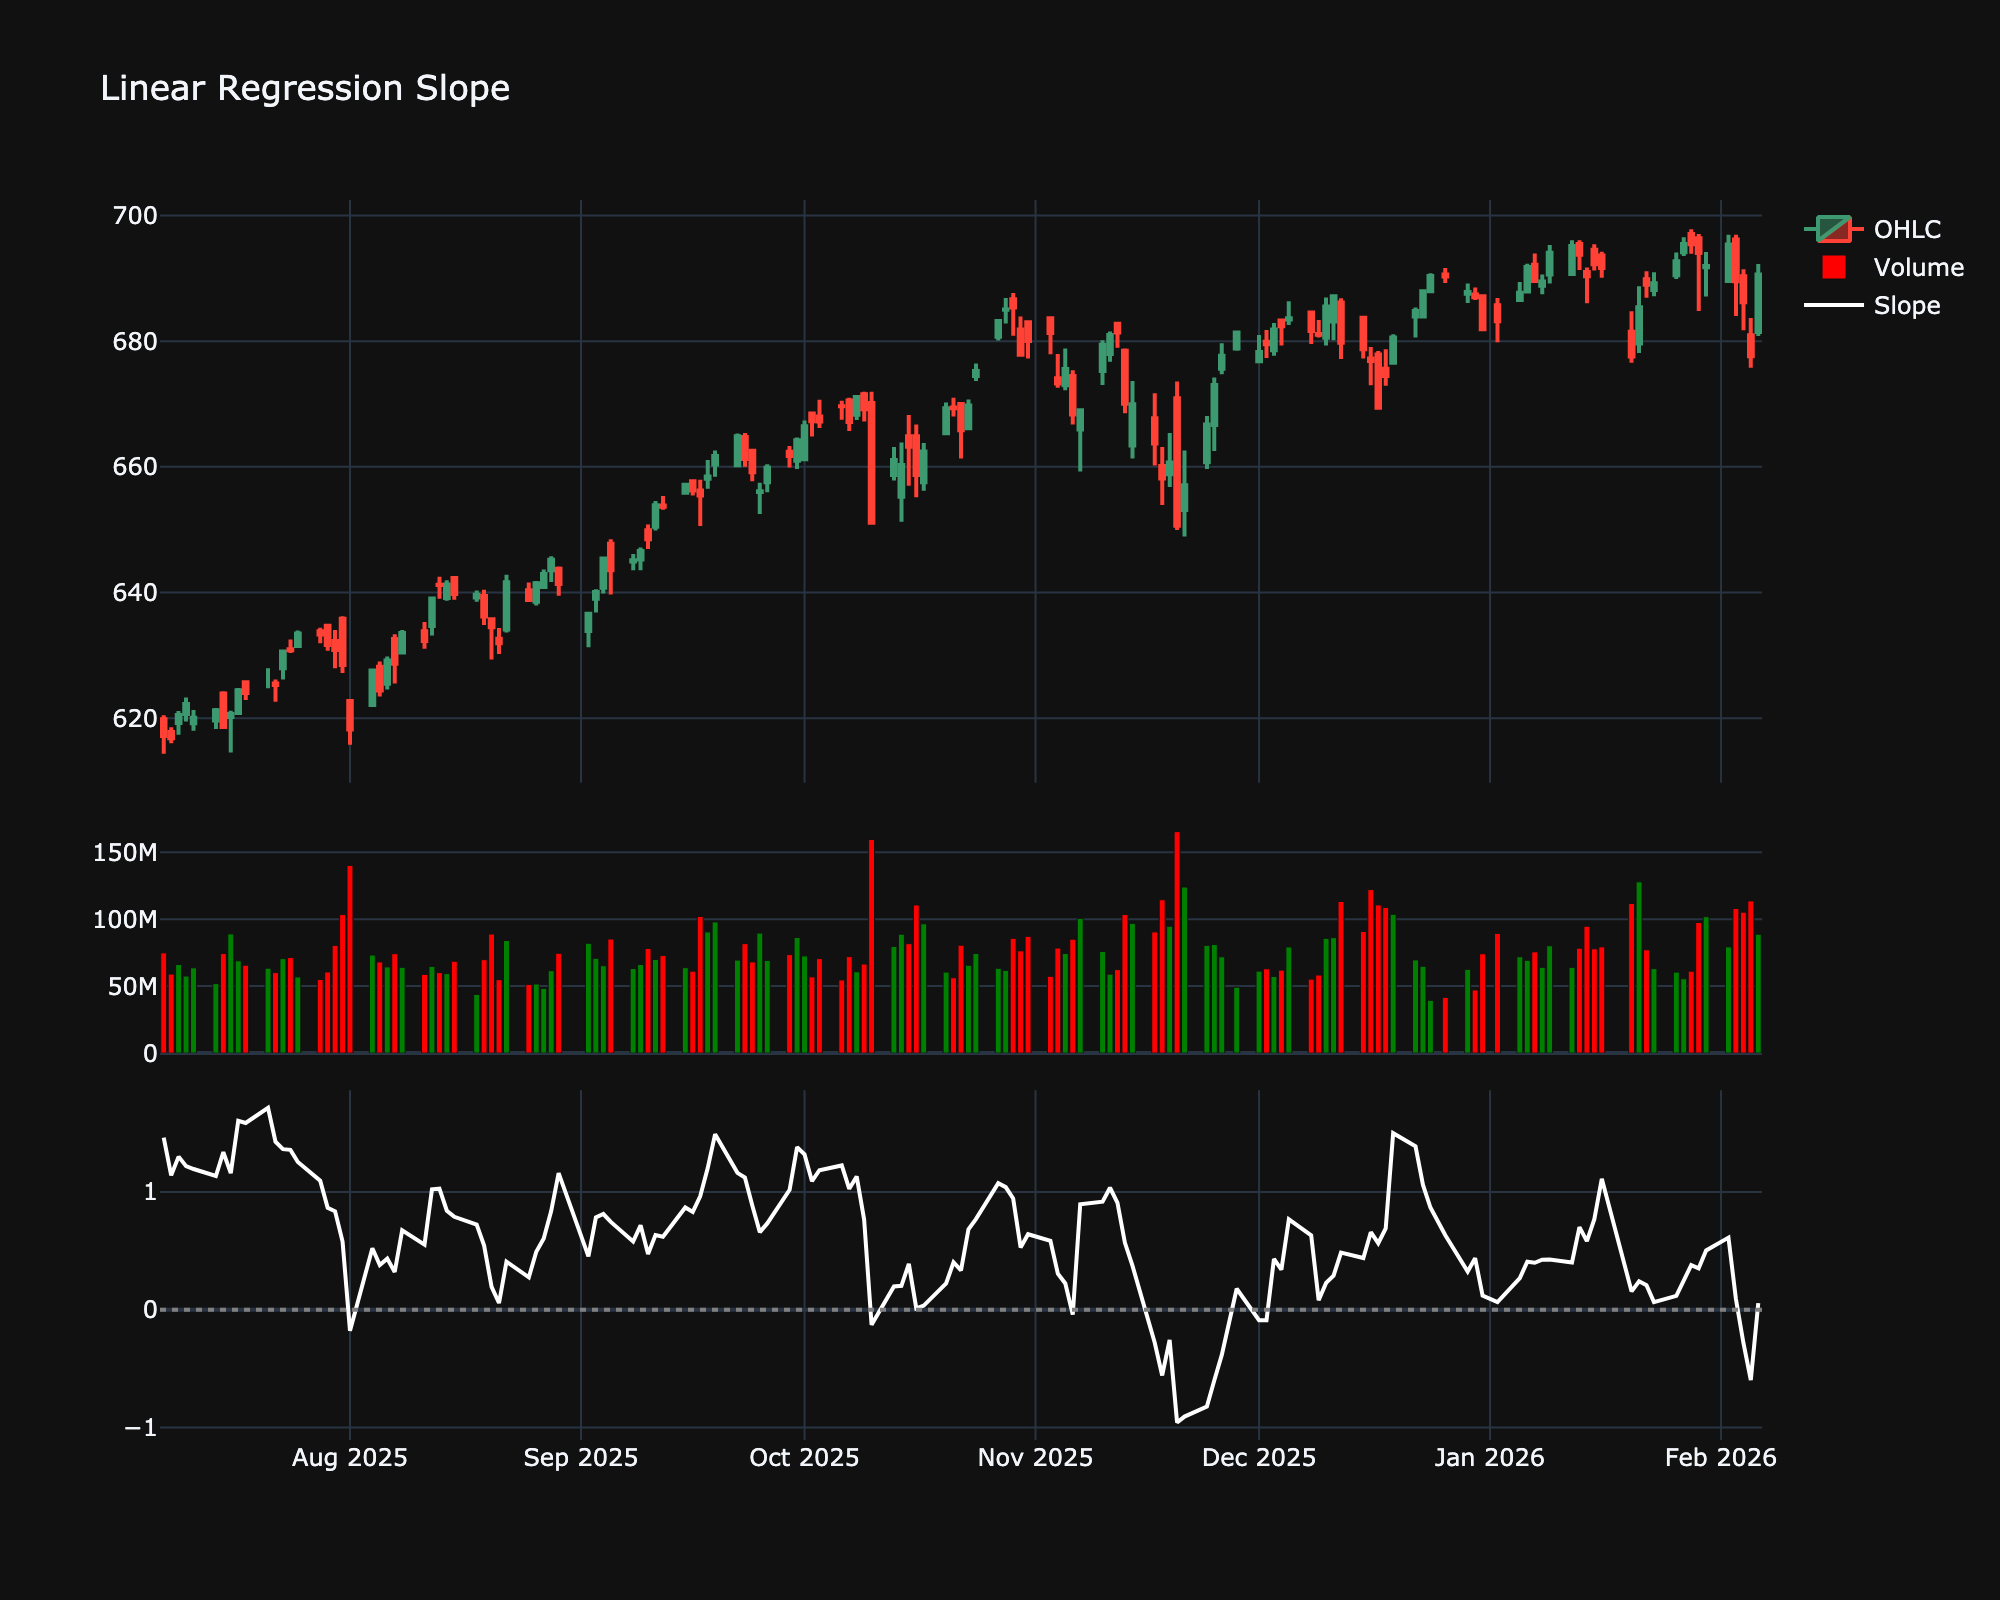
The Linear Regression Slope indicator displays the slope (steepness and direction) of the linear regression line fitted to the price over a specified period. It measures the strength and direction of the trend.
Mathematical Equation
For a rolling window of \(N\) periods, calculate the slope \(m\) of the best-fit line \(y = mx + b\) using the least squares method:
\[
m = \frac{n \sum (xy) - \sum x \sum y}{n \sum x^2 - (\sum x)^2}
\]
-
Positive Slope: Uptrend.
-
Negative Slope: Downtrend.
-
High Absolute Value: Strong trend.
Special cases
- Maximum possible value: Unbounded
- Minimum possible value: Unbounded
- Behavior: Oscillates around zero, indicating the angle (momentum) of the linear regression line.
Visualization
Trading Significance
-
Trend Strength: The steeper the slope, the stronger the trend.
-
Trend Reversal: A change in the sign of the slope (crossing zero) indicates a potential change in trend direction.