Linear Regression Curve
| Name | Type | Prerequisite | Use Cases |
|---|---|---|---|
| Linear Regression Curve (LRC) | Trend | SMA | Identifying the "fair value" path of a trend. |
Definition
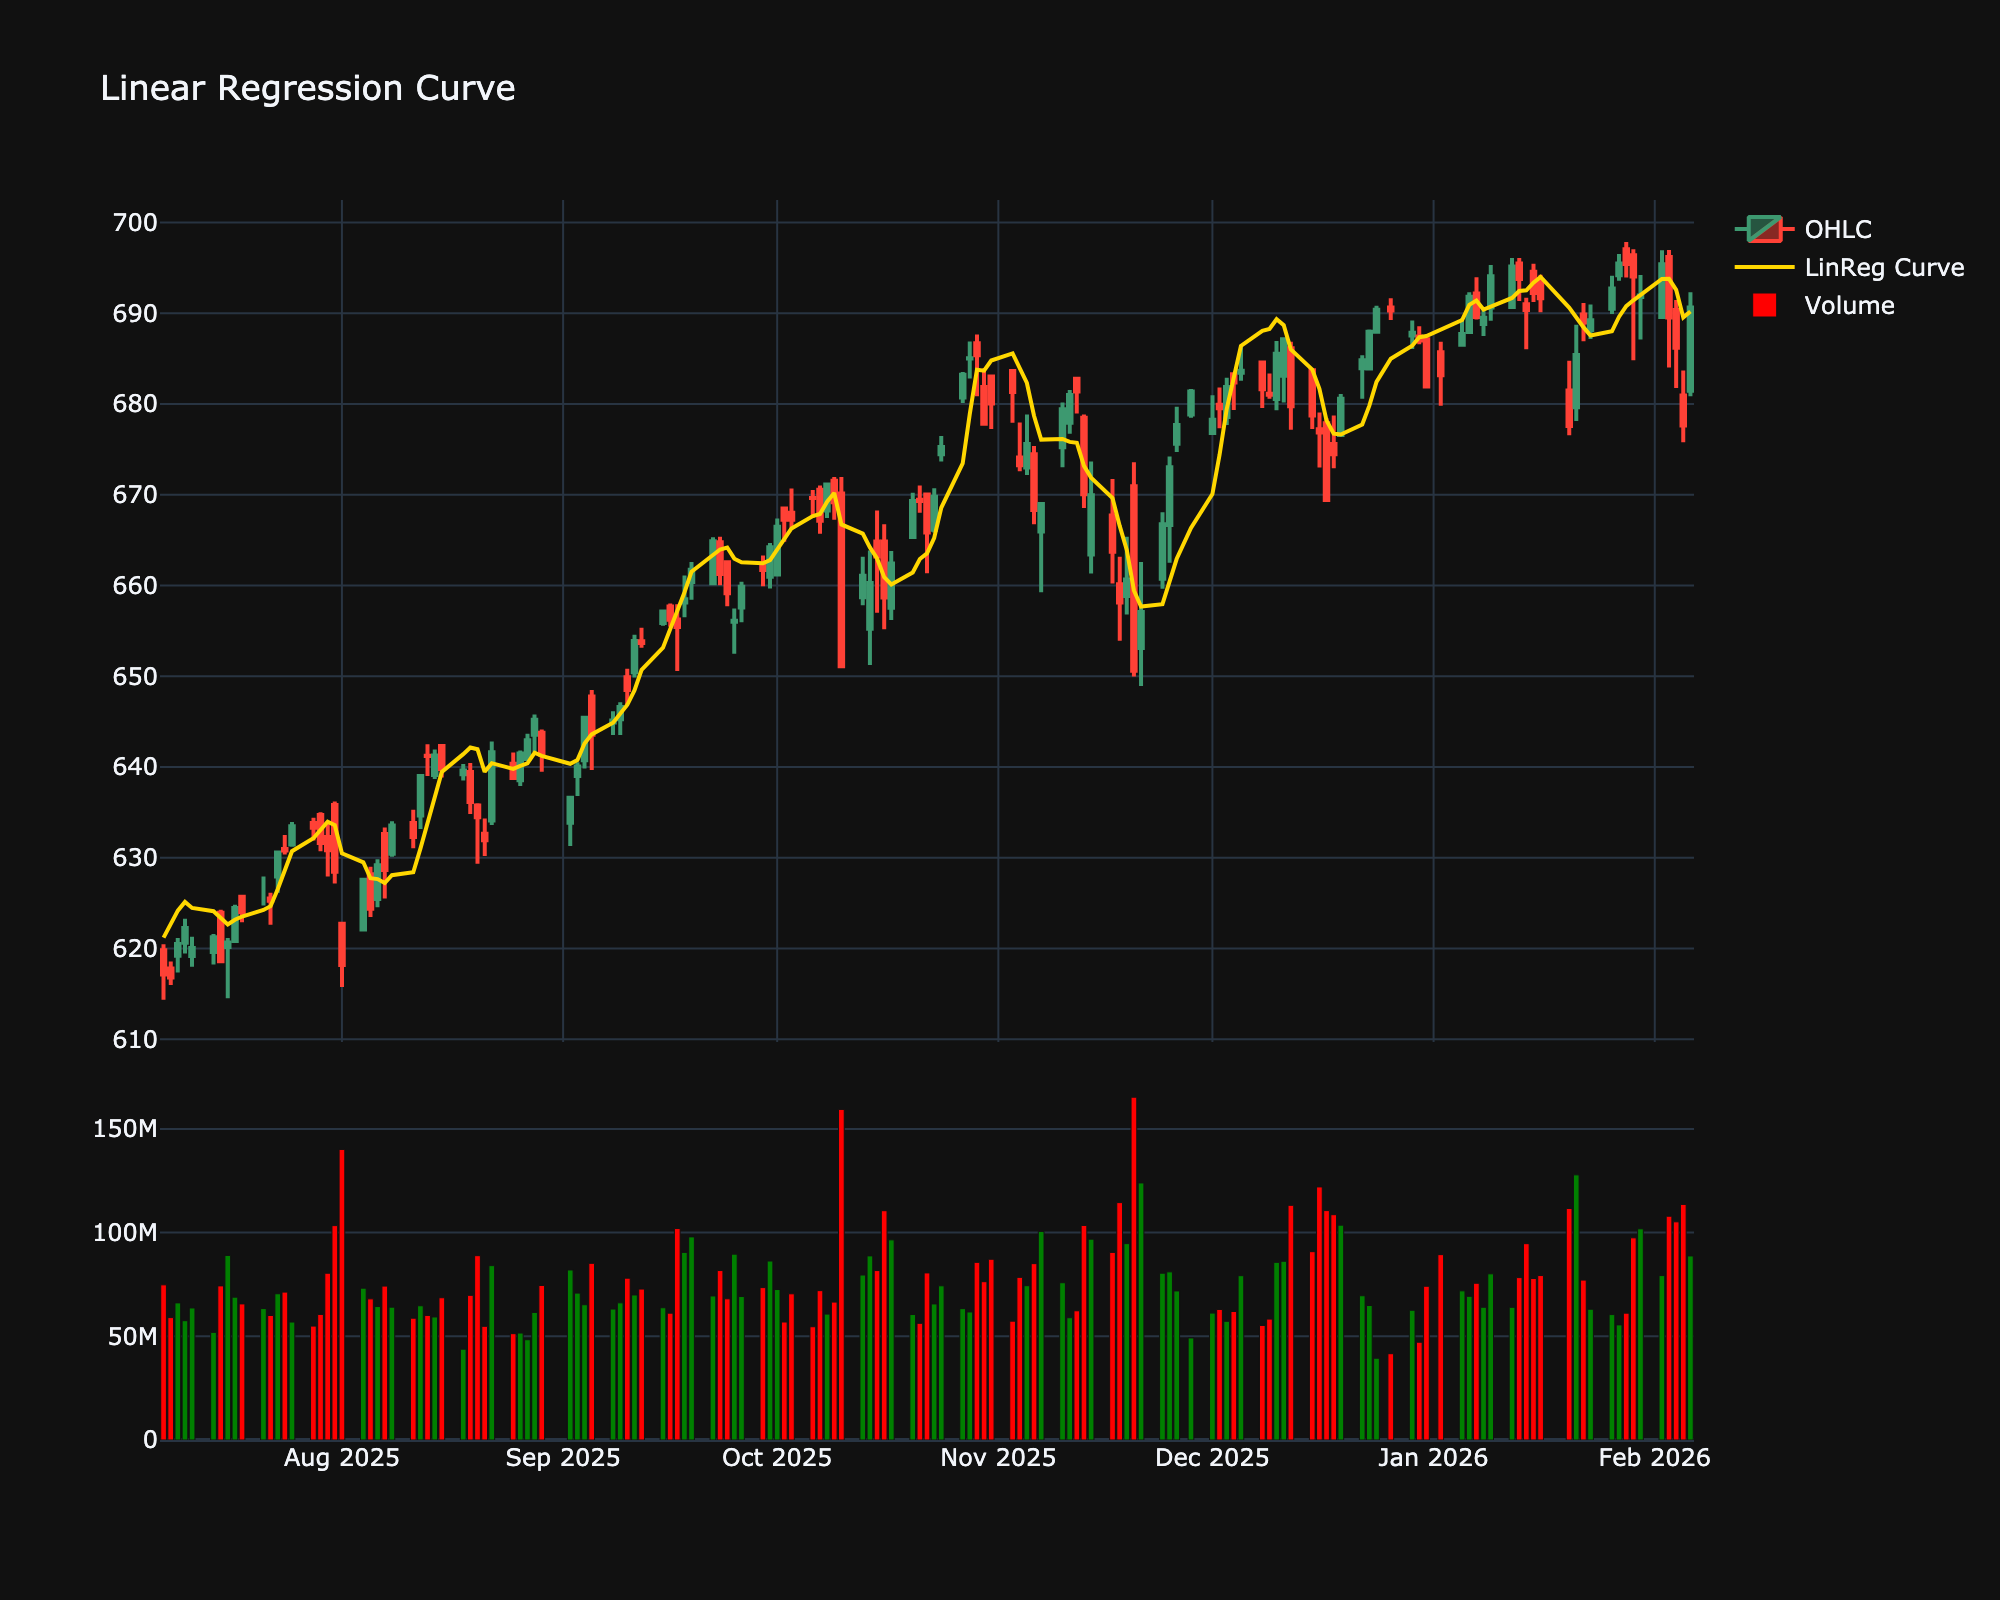
The Linear Regression Curve plots the end values of linear regression lines fitted to a rolling window of prices. It is essentially the same as the Least Squares Moving Average (LSMA). It provides a smoothed representation of the price trend based on statistical regression.
Mathematical Equation
For each point \(t\), fit a line \(y = mx + b\) to the previous \(N\) prices. The curve value is the value of this line at \(t\).
Special cases
- Maximum possible value: Unbounded
- Minimum possible value: 0
- Behavior: Follows the price by mapping the end points of rolling linear regression lines.
Visualization
Trading Significance
-
Trend direction: The slope of the curve indicates the trend direction.
-
Fit: It tends to fit the data better than simple moving averages, reacting faster to price changes.