Mass Index
| Name | Type | Prerequisite | Use Cases |
|---|---|---|---|
| Mass Index (MI) | Volatility/Momentum | EMA | Predicting "reversal bulges" where a trend is about to turn. |
Definition
The Mass Index is a volatility indicator developed by Donald Dorsey. It is designed to identify reversals by measuring the narrowing and widening of the range between the high and low prices. It does not identify the direction of the trend, only potential reversal points.
Mathematical Equation
-
Calculate the 9-day EMA of the High-Low range (\(EMA_9\)).
-
Calculate the 9-day EMA of the \(EMA_9\) (\(EMA_{9\_of\_9}\)).
-
Calculate the Ratio: \(R = \frac{EMA_9}{EMA_{9\_of\_9}}\).
-
Sum the Ratio over 25 periods:
\[
Mass Index = \sum_{i=1}^{25} R_i
\]
Special cases
- Maximum possible value: Unbounded
- Minimum possible value: 0
- Behavior: Moves independently. It spots trend reversals by tracking the expansion and contraction of the high-low range.
Visualization
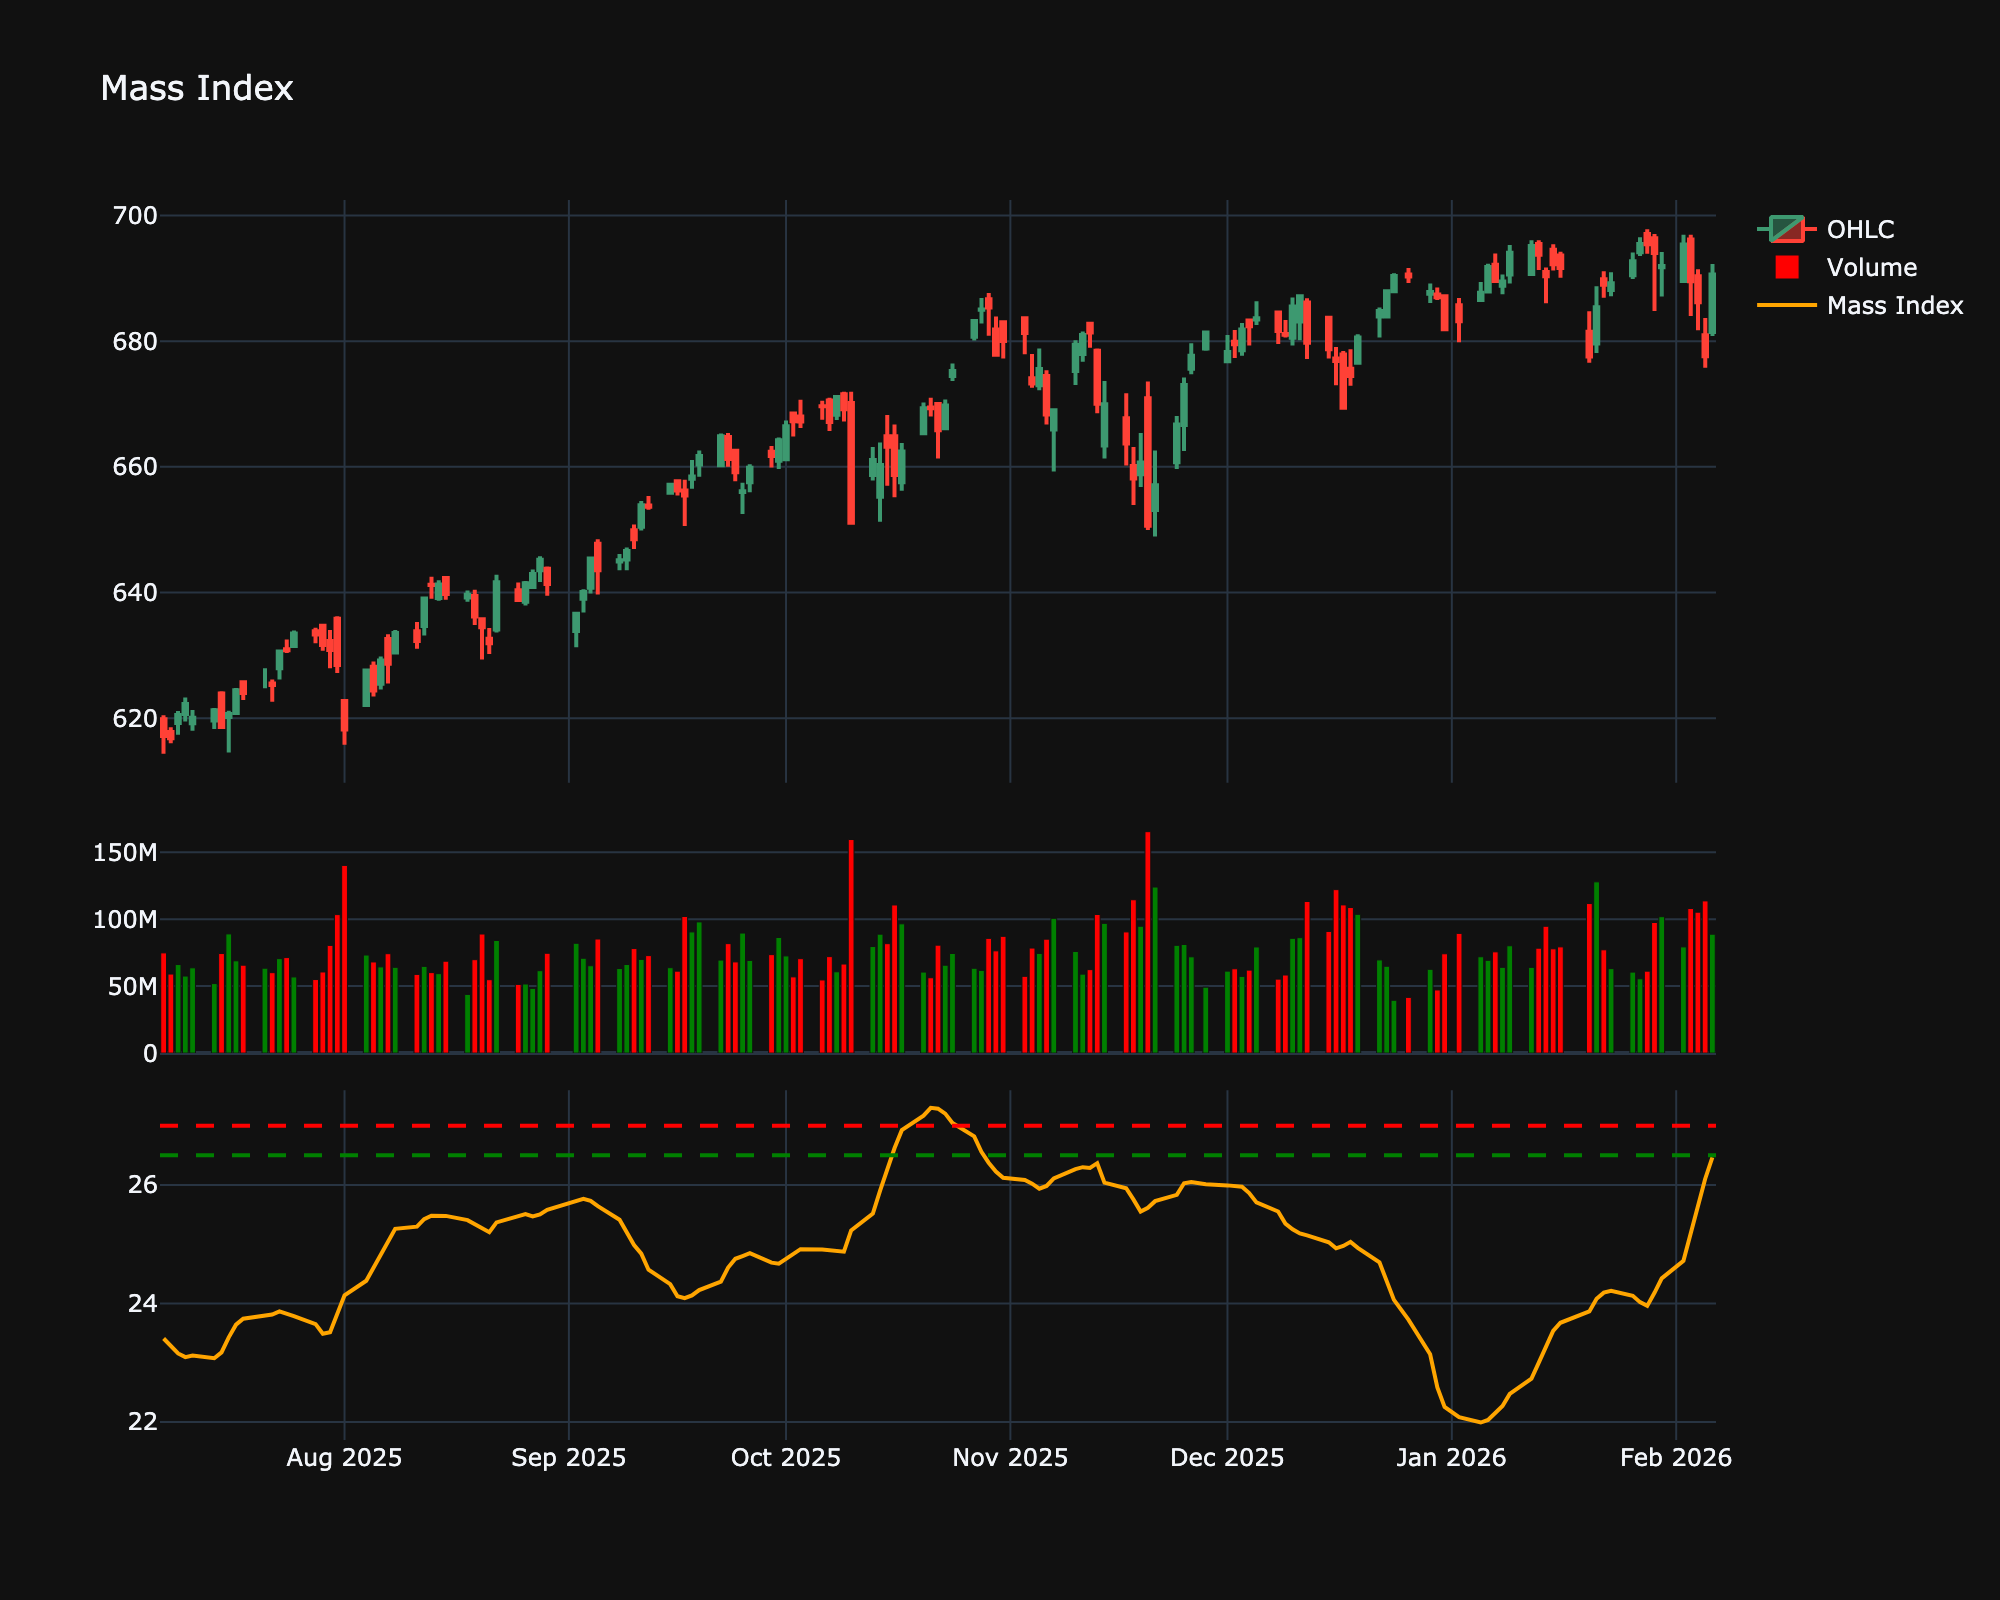
Trading Significance
- Reversal Bulge: The primary signal is the "reversal bulge." This occurs when the Mass Index rises above 27 and then drops below 26.5. This pattern suggests a reversal of the current trend is likely.