Hanging Man
| Name | Type | Prerequisite | Use Cases |
|---|---|---|---|
| Hanging Man | Bearish Reversal | OHLC Data | Signaling a potential top. |
Definition
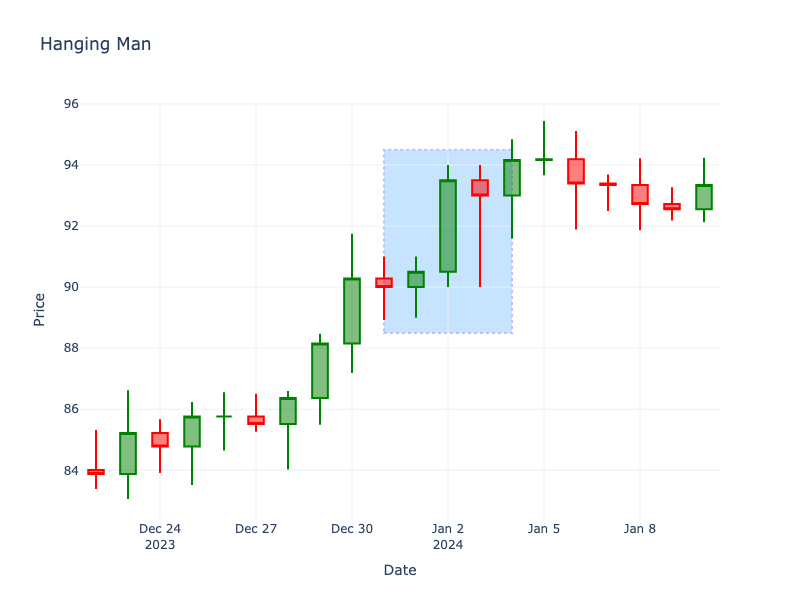
The Hanging Man looks exactly like a Hammer but forms at the top of an uptrend. It has a small real body at the upper end of the trading range and a long lower shadow.
Pattern Structure
- Context: Forms in an uptrend.
- Lower Shadow: Long, at least 2x body.
- Upper Shadow: Little to none.
- Body: Small (green or red, though red is more bearish).
Visualization
Story
Riding high on an uptrend, the market suddenly experiences a severe bout of vertigo. A massive wave of selling forces the price plummeting intra-day, creating deep panic. Although the bulls manage to claw their way back to close near the open, the psychological damage is done. The long lower wick reveals that a massive reservoir of selling pressure exists just below the surface, warning that the bull run is standing on a trapdoor.
Trading Significance
- Vulnerability: The long lower shadow shows that sellers were able to push the price down significantly during the session.
- Warning Sign: Even though it closed near the high, the selling pressure is a warning that bulls are losing control.