Shooting Star
| Name | Type | Prerequisite | Use Cases |
|---|---|---|---|
| Shooting Star | Bearish Reversal | OHLC Data | Identifying potential tops in an uptrend. |
Definition
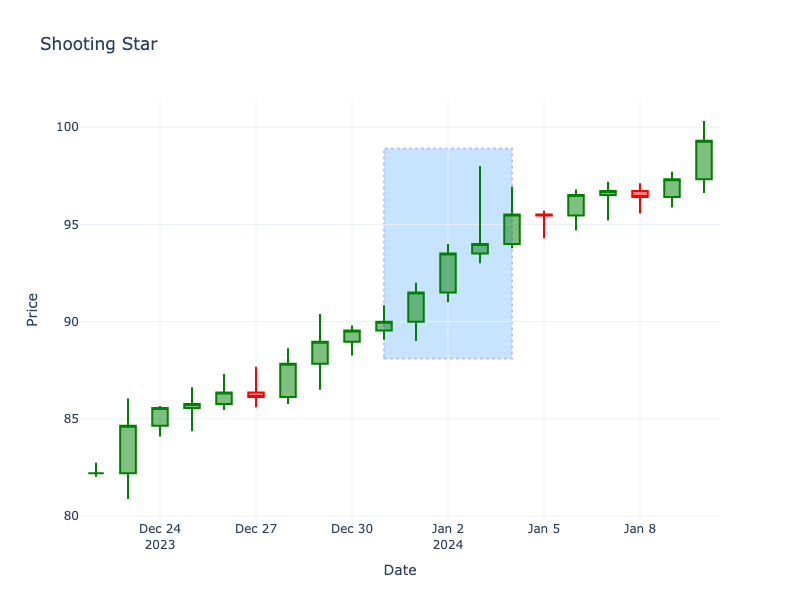
The Shooting Star is a bearish reversal pattern that forms during an uptrend. It usually opens with a gap up, trades significantly higher during the day, but closes near the open. It has a small real body at the lower end of the range and a long upper shadow.
Pattern Structure
- Body: Small, located at the lower end of the trading range.
- Upper Shadow: Long, at least 2x the body length.
- Lower Shadow: Little to none.
Mathematical Representation
\[
UpperShadow \ge 2 \times |Open - Close|
\]
Visualization
Story
Riding the wave of an uptrend, the bulls push prices to new euphoric heights, seemingly unstoppable. However, at the peak of the session, they hit a solid wall of selling pressure. The bears aggressively step in, taking profits and initiating short positions, completely reversing the intraday gains. The market closes weakly near its opening, leaving behind a long upper wick—a stark monument to the buyers' failed advance.
Trading Significance
- Rejection of Highs: Shows that buyers pushed prices up, but sellers overwhelmed them to push the price back down.
- Bearish Signal: Indicates potential exhaustion of the uptrend.
- Confirmation: Look for a gap down or a long red candle following the shooting star.