SuperTrend
| Name | Type | Prerequisite | Use Cases |
|---|---|---|---|
| SuperTrend (ST) | Trend/Regime | ATR | Clear buy/sell signals and trailing stops. |
Definition
SuperTrend is a trend-following indicator similar to moving averages. It is plotted on prices and their placement indicates the current trend. It relies on the Average True Range (ATR) to calculate its value.
Mathematical Equation
\[
\text{Upper Band} = \frac{(\text{High} + \text{Low})}{2} + (\text{Multiplier} \times \text{ATR})
\]
\[
\text{Lower Band} = \frac{(\text{High} + \text{Low})}{2} - (\text{Multiplier} \times \text{ATR})
\]
The SuperTrend line switches between Upper and Lower/Close depending on trend direction.
Special cases
- Maximum possible value: Unbounded
- Minimum possible value: 0
- Behavior: Follows the price, indicating the current trend direction and acting as a trailing stop.
Visualization
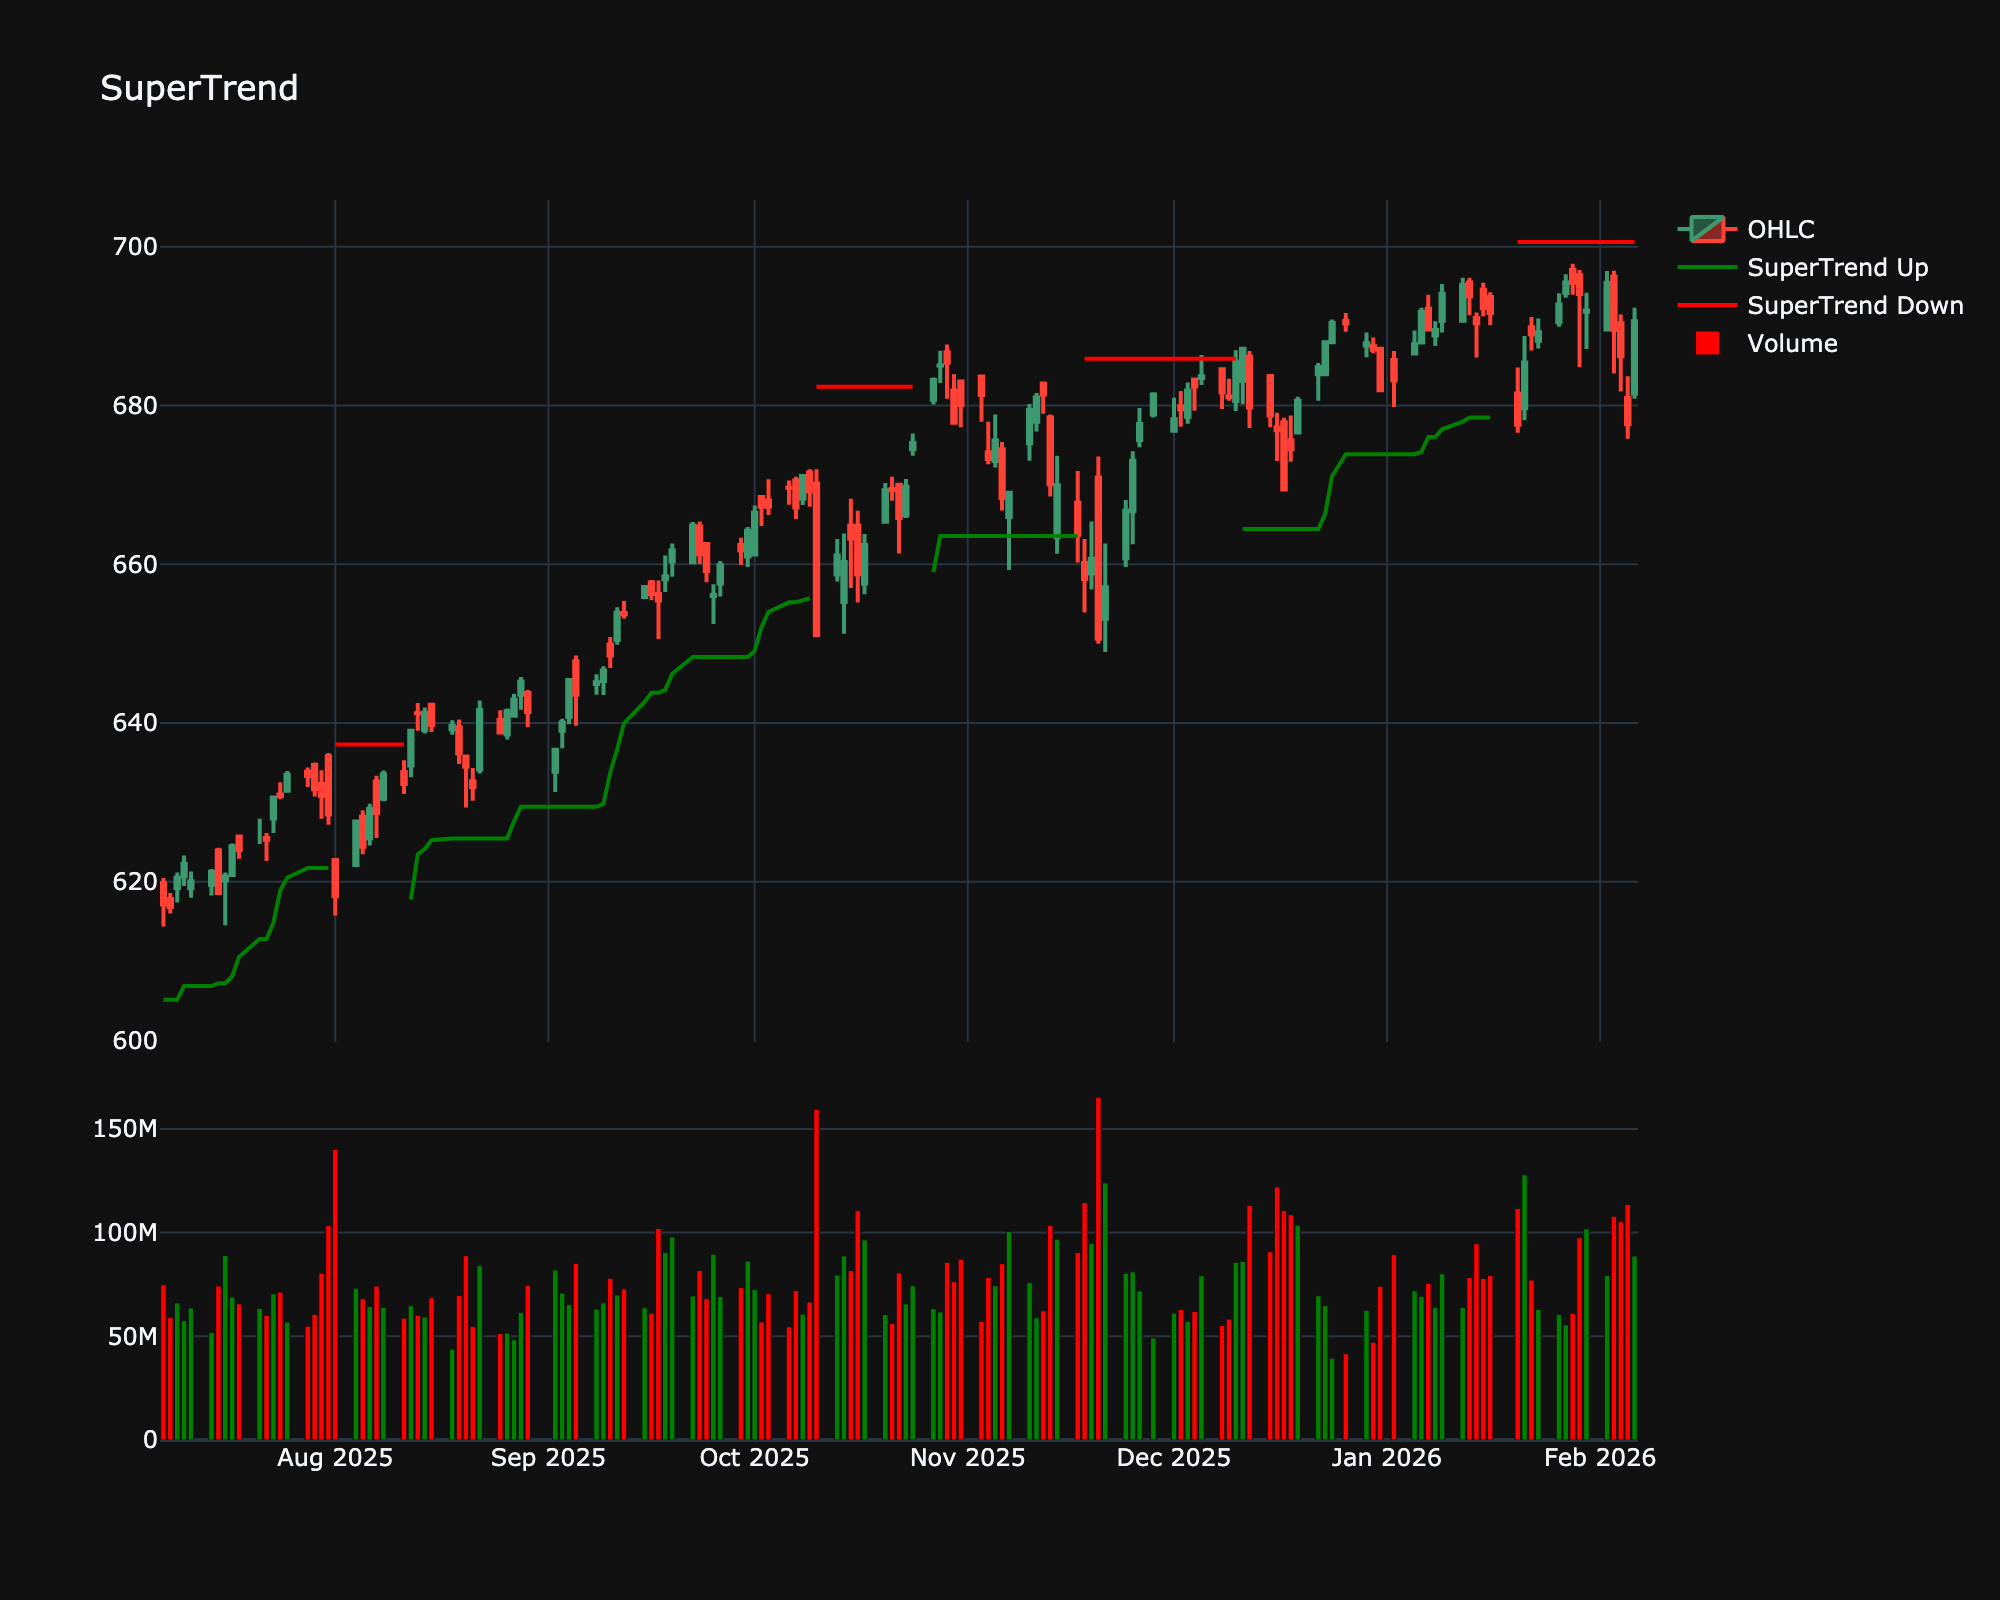
Trading Significance
-
Stop Loss: Excellent for trailing stop losses.
-
Trend Direction: Buying when the line flips to green (below price) and selling when it flips to red (above price).