Stochastic Oscillator
| Name | Type | Prerequisite | Use Cases |
|---|---|---|---|
| Stochastic Oscillator (STOCH) | Momentum | OHLC Data | Mean reversion and divergence trading. |
Definition
The Stochastic Oscillator is a momentum indicator comparing a particular closing price of a security to a range of its prices over a certain period of time. The sensitivity of the oscillator to market movements is reducible by adjusting that time period or by taking a moving average of the result.
Mathematical Equation
Where:
-
\(C\) = The most recent closing price
-
\(L_{14}\) = The lowest price traded of the 14 previous trading sessions
-
\(H_{14}\) = The highest price traded during the same 14-day period
-
\(\%K\) = The current value of the stochastic indicator
Special cases
- Maximum possible value: 100
- Minimum possible value: 0
- Behavior: Oscillates between 0 and 100, comparing the closing price to a range of prices over time.
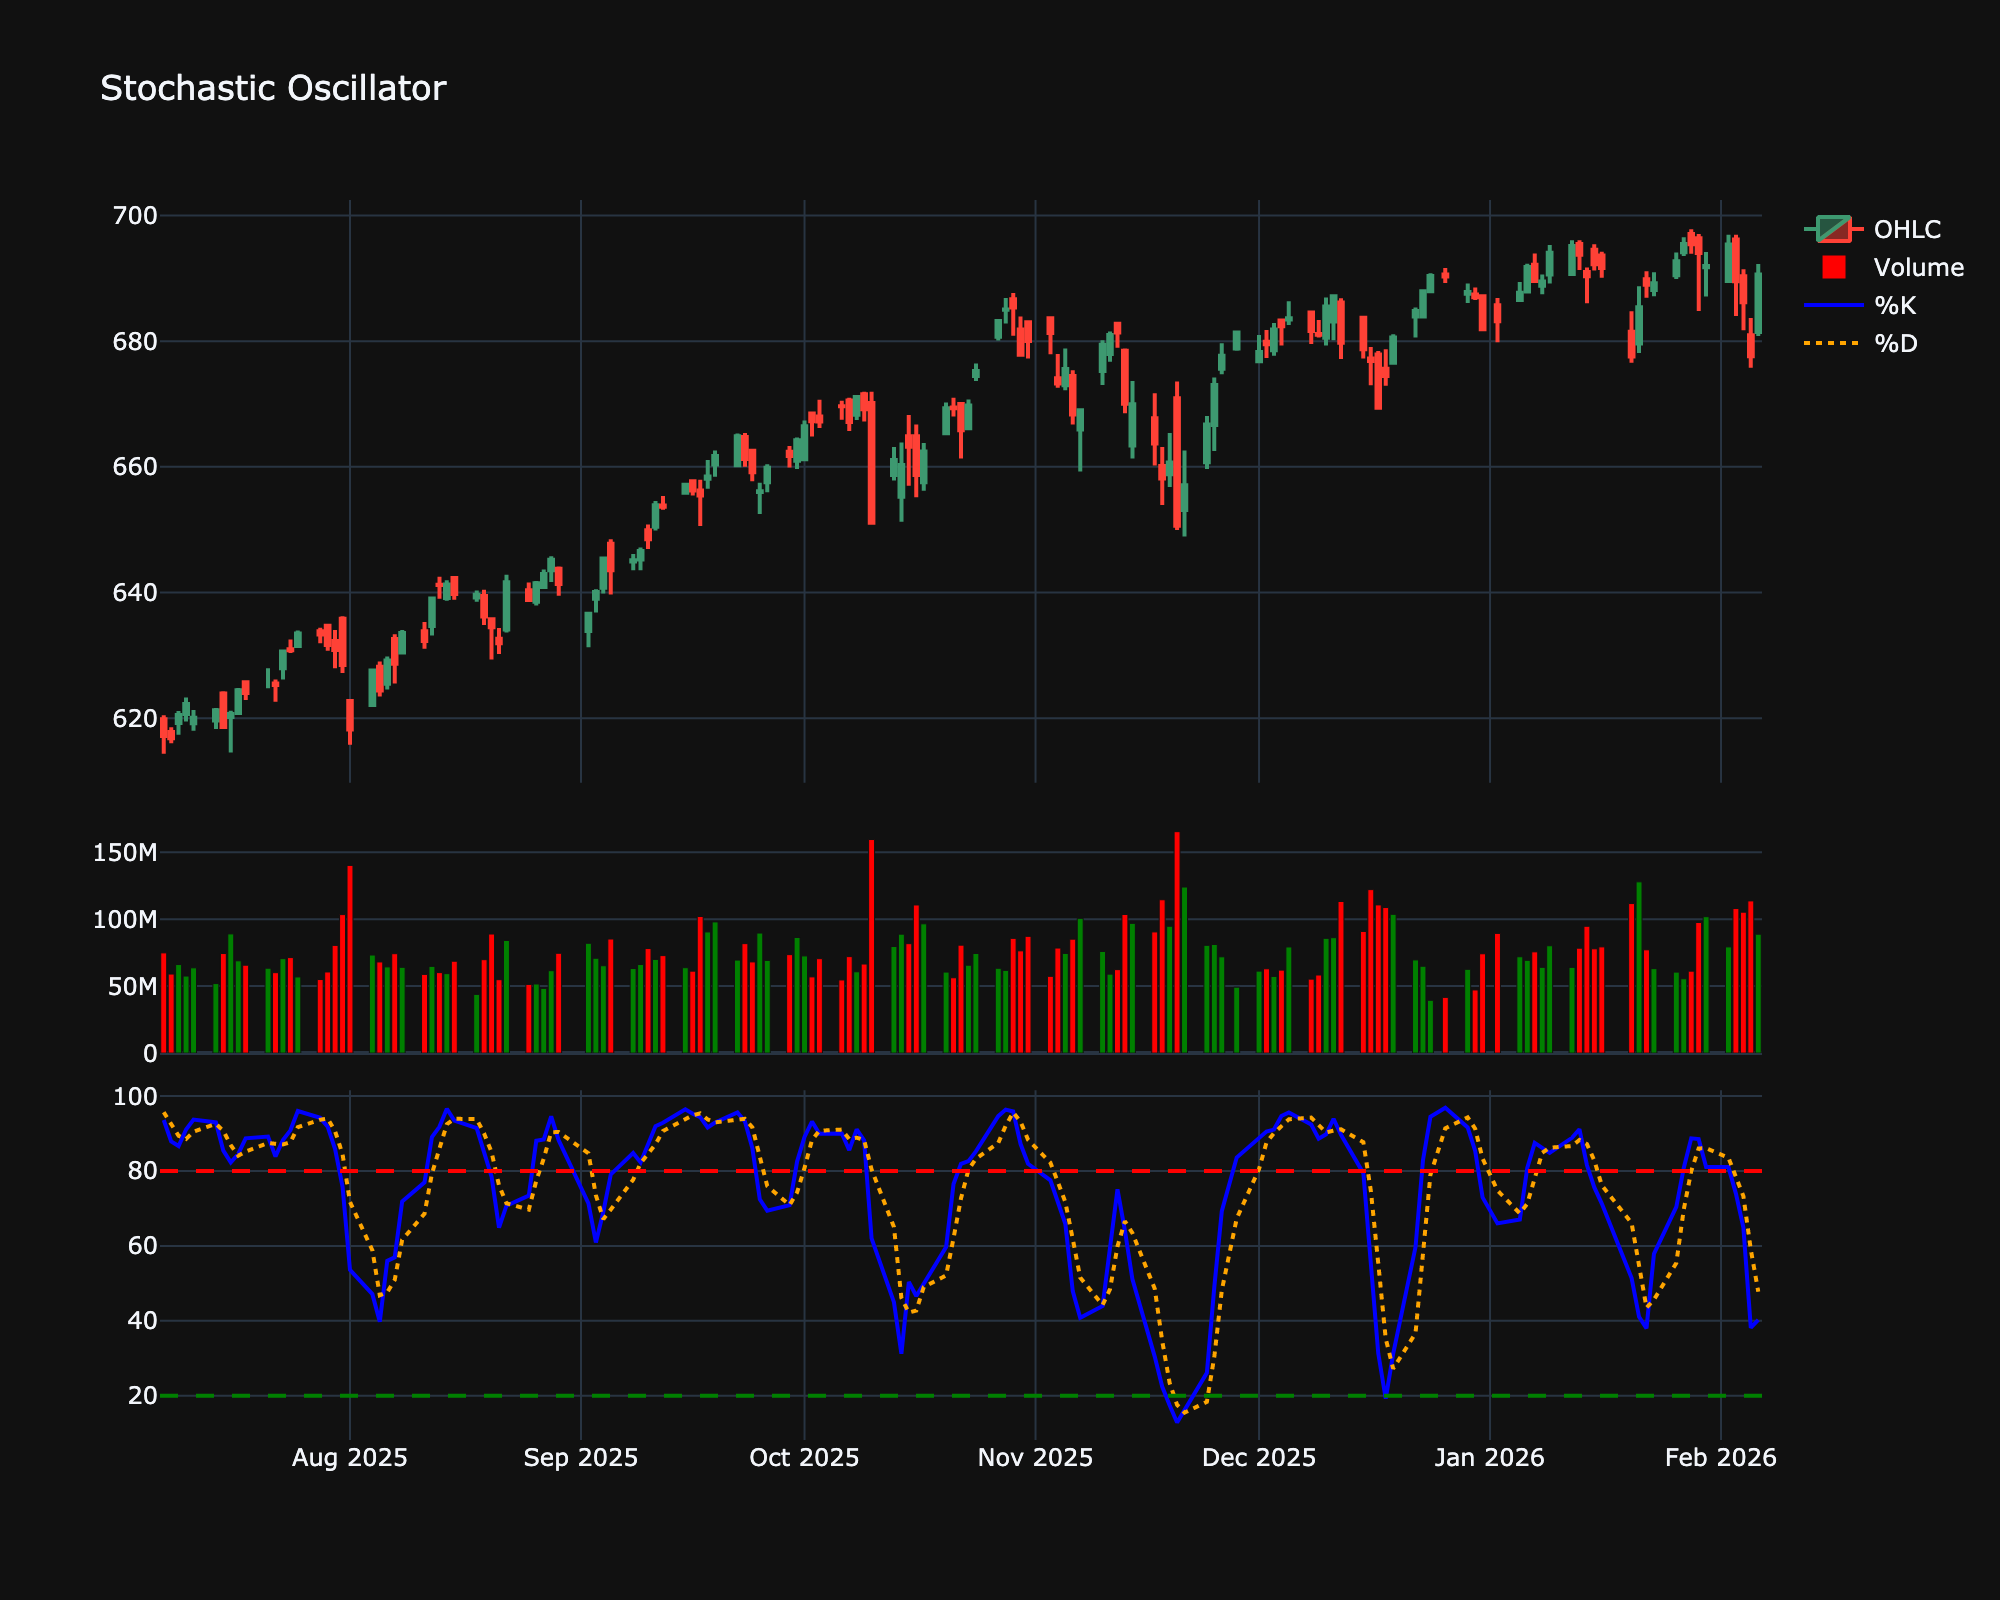
Visualization
Trading Significance
-
Overbought/Oversold: Values > 80 indicate overbought; < 20 indicate oversold.
-
Crossovers: %K crossing above %D is a buy signal; below is a sell signal.
-
Divergence: Bullish/Bearish divergence signals potential reversals.