Exponential Moving Average (EMA)
| Name | Type | Prerequisite | Use Cases |
|---|---|---|---|
| Exponential Moving Average (EMA) | Trend | OHLC Data | Reduces lag in trend following compared to SMA. |
Definition
The Exponential Moving Average (EMA) is a type of moving average that places a greater weight and significance on the most recent data points. The EMA reacts more significantly to recent price changes than a simple moving average (SMA), which applies an equal weight to all observations in the period.
Mathematical Equation
The formula for calculating the EMA involves using a multiplier to give more weight to the most recent price.
Actually, the standard formula is:
Where:
-
\(EMA_t\) = Current EMA value
-
\(V_t\) = Current Value
-
\(EMA_y\) = Previous EMA value
-
\(s\) = Smoothing factor (typically 2)
-
\(d\) = Number of days
Simplified:
Special cases
- Maximum possible value: Unbounded
- Minimum possible value: 0
- Behavior: Follows the price, smoothing out price action to identify the trend direction. Plotted on the price chart.
Visualization
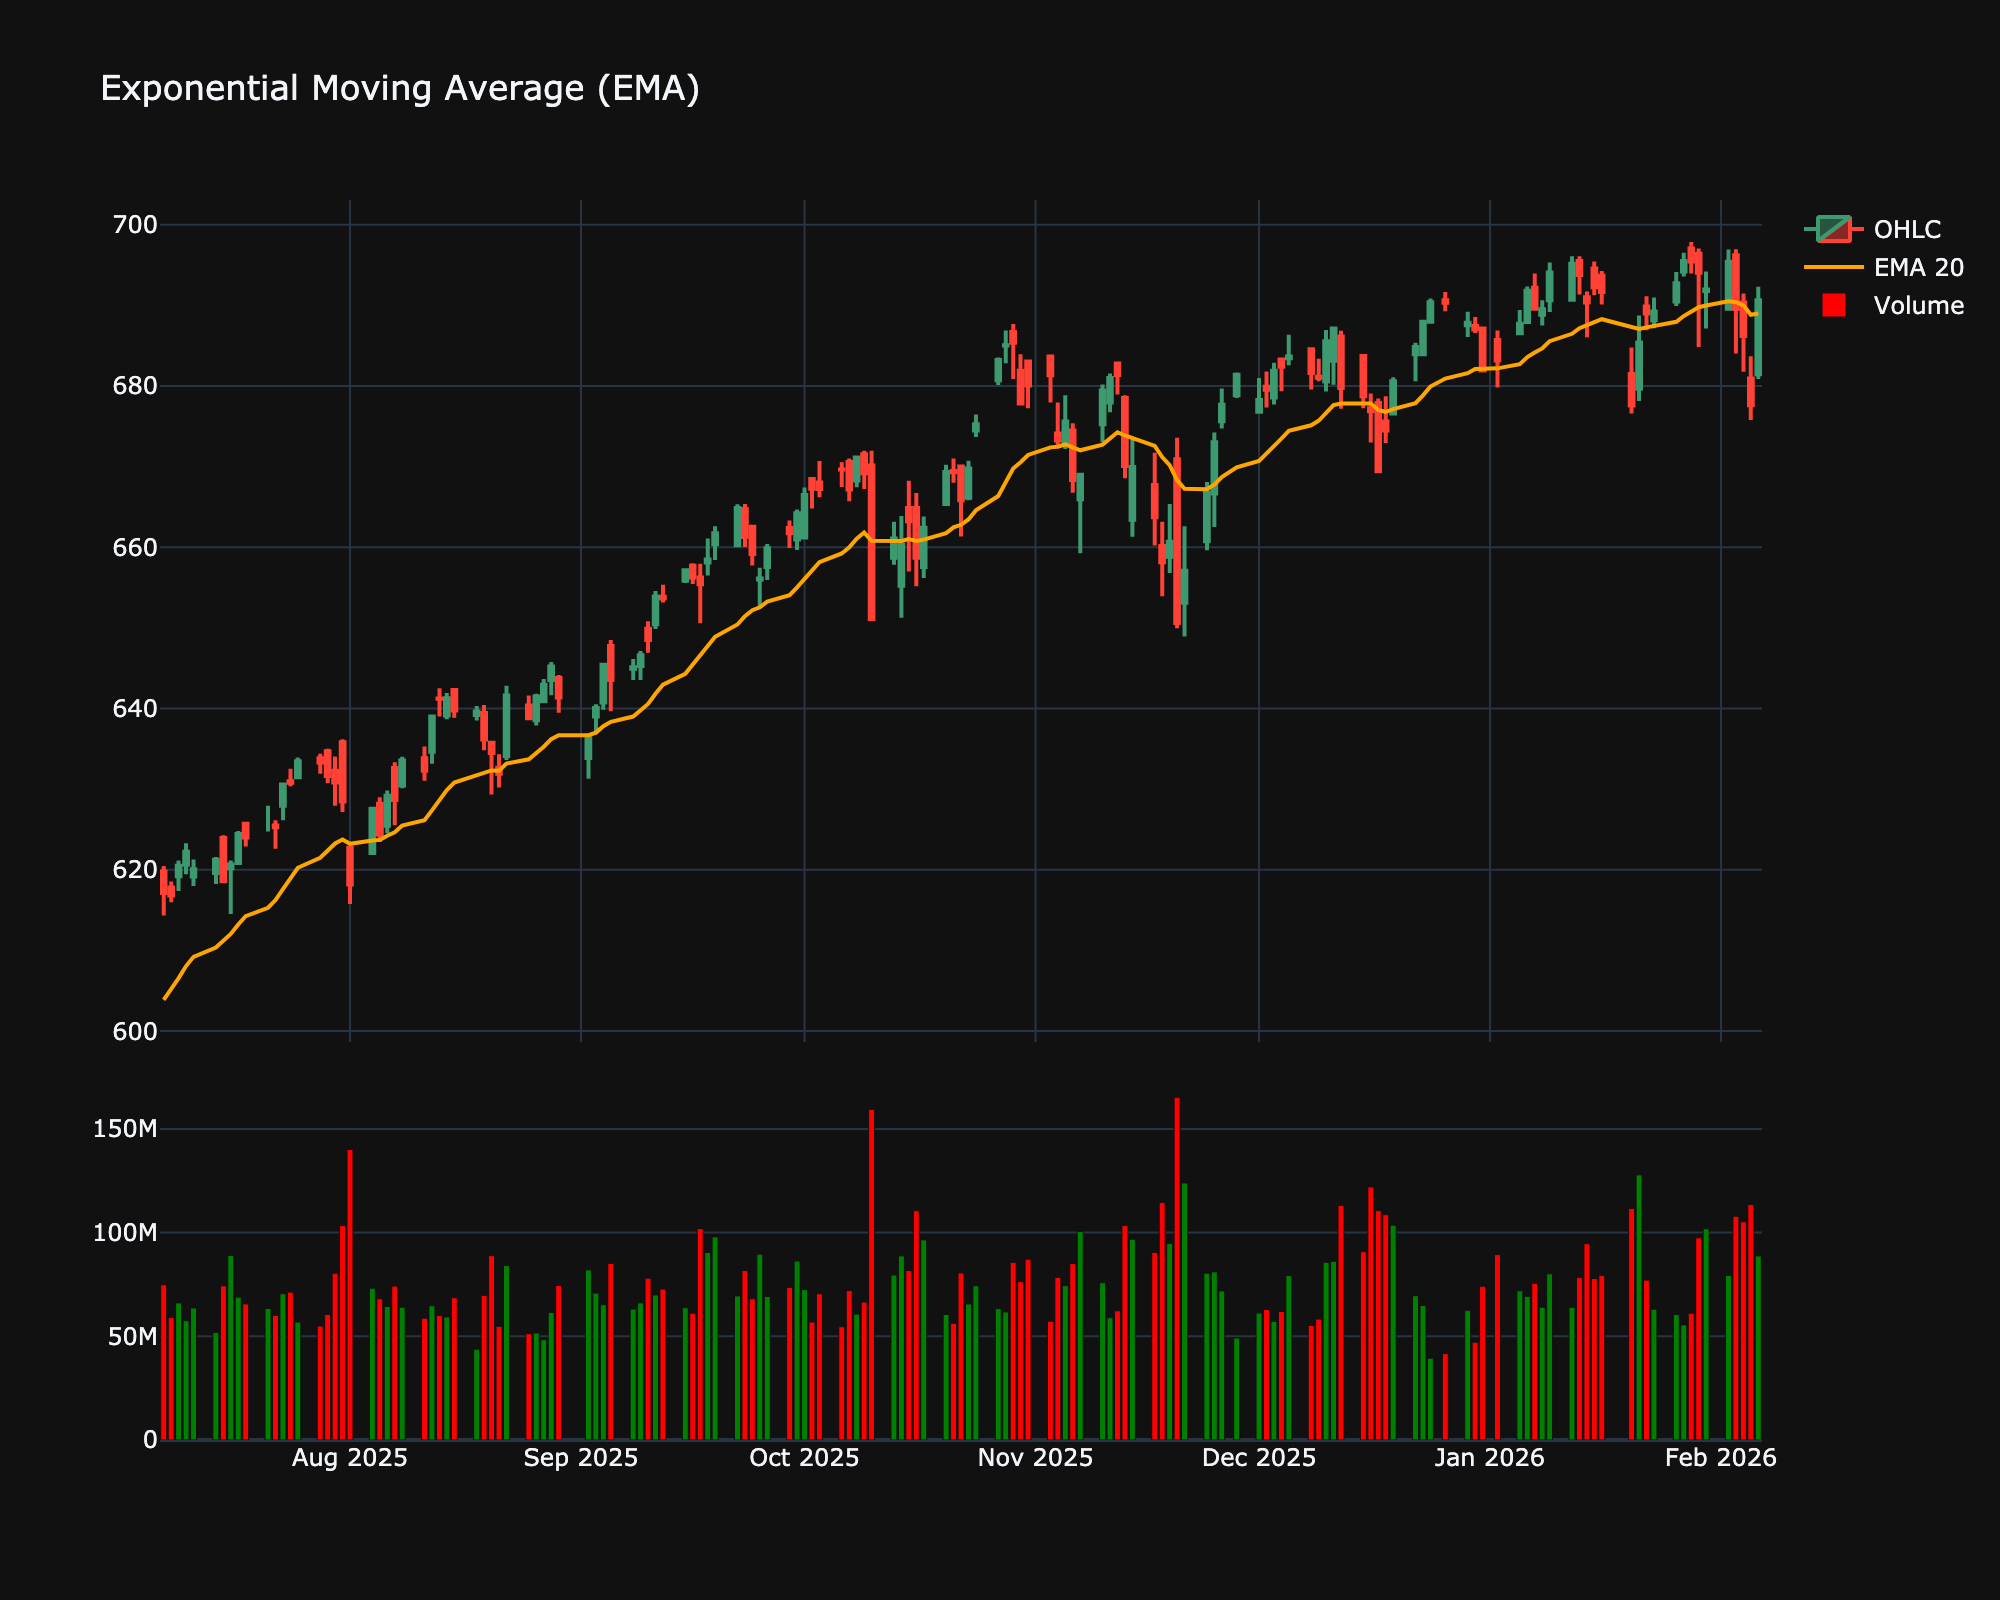
Trading Significance
The EMA is preferred by many traders over the SMA because it reduces the lag by weighting recent prices more heavily.
-
Trend Confirmation: Like the SMA, the EMA is used to identify the trend direction. A rising EMA indicates an uptrend, while a falling EMA indicates a downtrend.
-
Support and Resistance: Dynamic support/resistance levels are often identified using EMAs (e.g., the 20-period EMA).
-
Crossovers: The crossing of short-term (e.g., 12-day) and long-term (e.g., 26-day) EMAs provides buy and sell signals.