Coppock Curve
| Name | Type | Prerequisite | Use Cases |
|---|---|---|---|
| Coppock Curve (CC) | Momentum | WMA | Long-term investment timing in broad indices. |
Definition
The Coppock Curve is a long-term price momentum indicator used primarily to identify major bottoms in the stock market. It is calculated as a 10-month weighted moving average of the sum of the 14-month rate of change and the 11-month rate of change for the index. Although designed for monthly data, it can be applied to other timeframes.
Mathematical Equation
Special cases
- Maximum possible value: Unbounded
- Minimum possible value: Unbounded
- Behavior: Oscillates around zero, primarily used to identify long-term buying opportunities.
Visualization
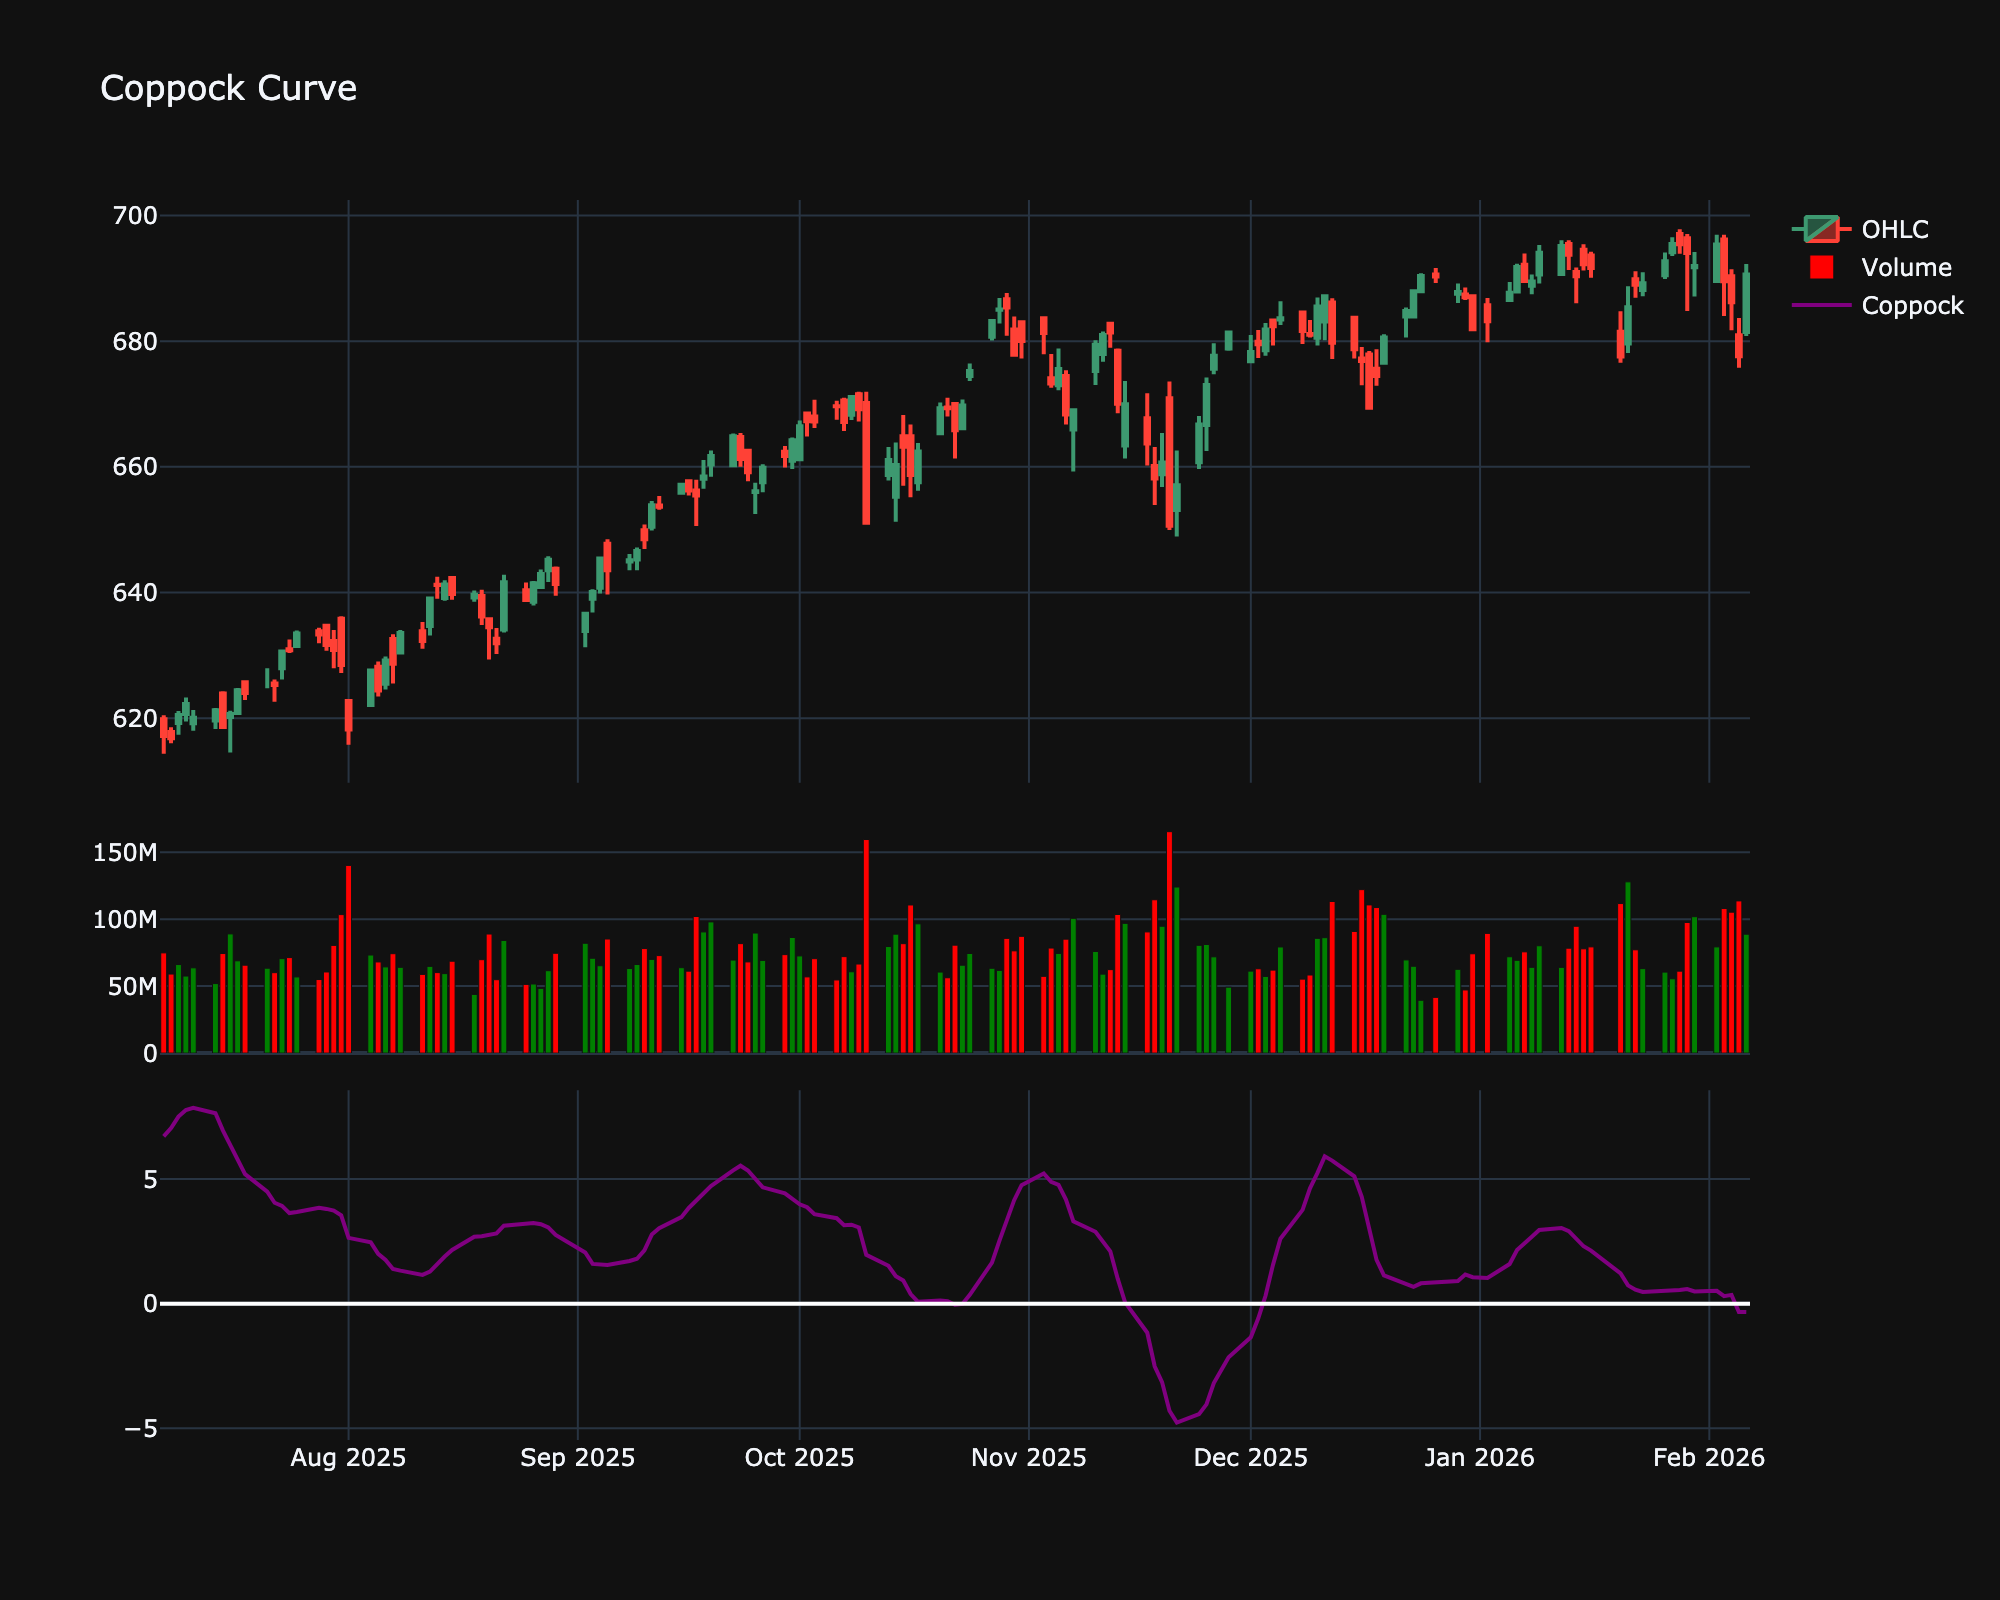
Trading Significance
-
Trend Signal: The primary signal is generated when the Coppock Curve rises from below zero into positive territory. This is interpreted as a "buy" signal for a new long-term bull market.
-
Zero Line: While crossing above zero is the main signal, remaining above zero generally confirms a bullish trend, and falling below zero indicates a bearish phase.
-
Divergence: Though less common, divergence analyses can also be applied.