Simple Moving Average (SMA)
| Name | Type | Prerequisite | Use Cases |
|---|---|---|---|
| Simple Moving Average (SMA) | Trend | OHLC Data | Baseline trend identification and institutional support/resistance. |
Definition
The Simple Moving Average (SMA) is one of the most fundamental technical indicators used in financial analysis. It calculates the arithmetic mean of a security's prices over a specific number of periods. By smoothing out price data, the SMA helps to identify the direction of the trend and filter out short-term price fluctuations or "noise." It is a lagging indicator, meaning it reacts to past price movements.
Mathematical Equation
The SMA is calculated by summing the closing prices over the last \(n\) periods and dividing by \(n\).
Where:
-
\(P_i\) is the price at period \(i\)
-
\(n\) is the number of periods
Special cases
- Maximum possible value: Unbounded
- Minimum possible value: 0
- Behavior: Follows the price smoothly to highlight the underlying trend.
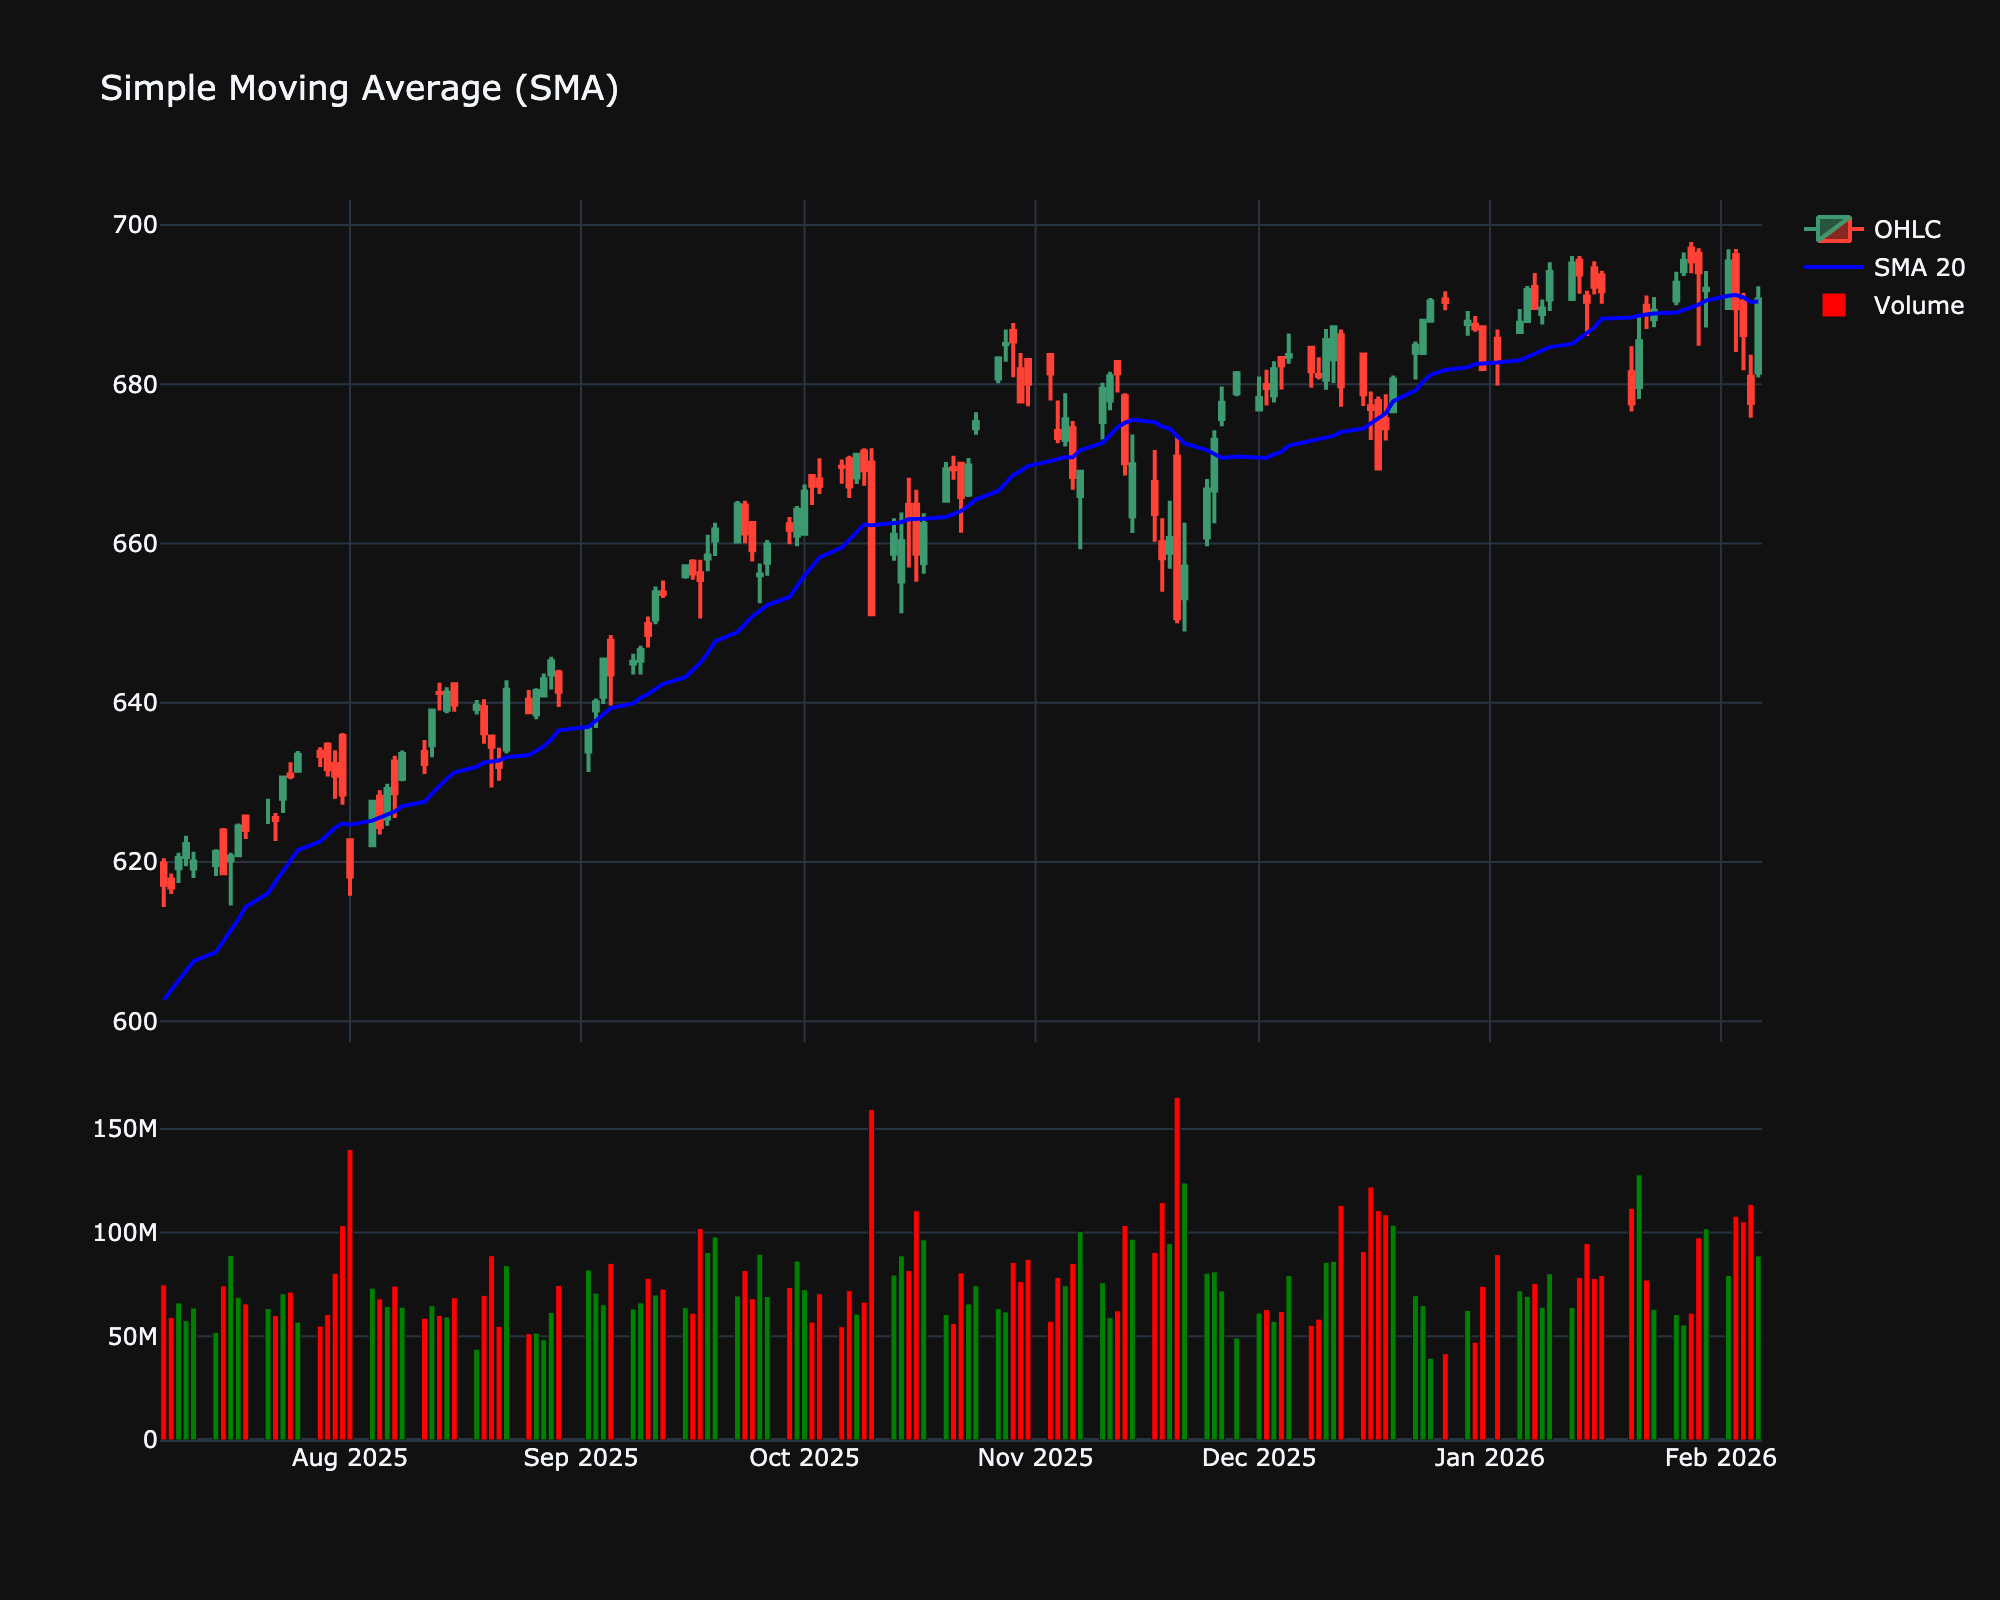
Visualization
Trading Significance
The SMA is widely used by traders for several purposes:
-
Trend Identification: If the price is above the rising SMA, the trend is considered bullish (upward). Conversely, if the price is below the falling SMA, the trend is bearish (downward).
-
Support and Resistance: Major SMAs (like the 50-day or 200-day) often act as dynamic support levels in uptrends and resistance levels in downtrends.
-
Crossovers:
-
Price Crossover: A buy signal is generated when the price crosses above the SMA, and a sell signal when it crosses below.
-
MA Crossover: Traders often use two SMAs (e.g., 50-day and 200-day). A "Golden Cross" occurs when the shorter-term SMA crosses above the longer-term SMA (bullish), while a "Death Cross" occurs when it crosses below (bearish).
-