Tweezer Bottoms
| Name | Type | Prerequisite | Use Cases |
|---|---|---|---|
| Tweezer Bottoms | Bullish Reversal | OHLC Data | Identifying support levels. |
Definition
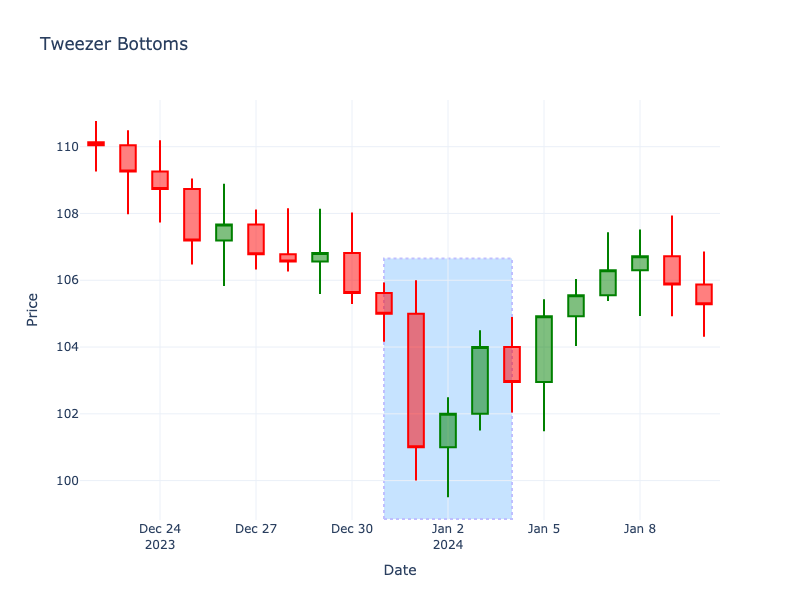
Tweezer Bottoms form when two or more candlesticks have the same (or very similar) low price. They indicate a firm support level that sellers cannot push below.
Pattern Structure
- Context: Downtrend.
- Candle 1: Usually a long red candle.
- Candle 2: Retests the exact low of Candle 1.
Visualization
Story
The bears drive the price down, establishing a distinct, hard floor. In the following session, they attempt to break this support level again, but are met with a literal brick wall from the buyers at the exact same price point. This repeated, precise rejection at a specific bottom creates a 'tweezer' shape, signaling to the market that an unbreakable line in the sand has been drawn by the bulls.
Trading Significance
- Support Confirmation: The market tested the same low twice and failed to break it.
- Double Bottom: Can be seen as a mini double bottom pattern.