Doji
| Name | Type | Prerequisite | Use Cases |
|---|---|---|---|
| Doji | Reversal / Indecision | OHLC Data | Identifying market indecision and potential reversals. |
Definition
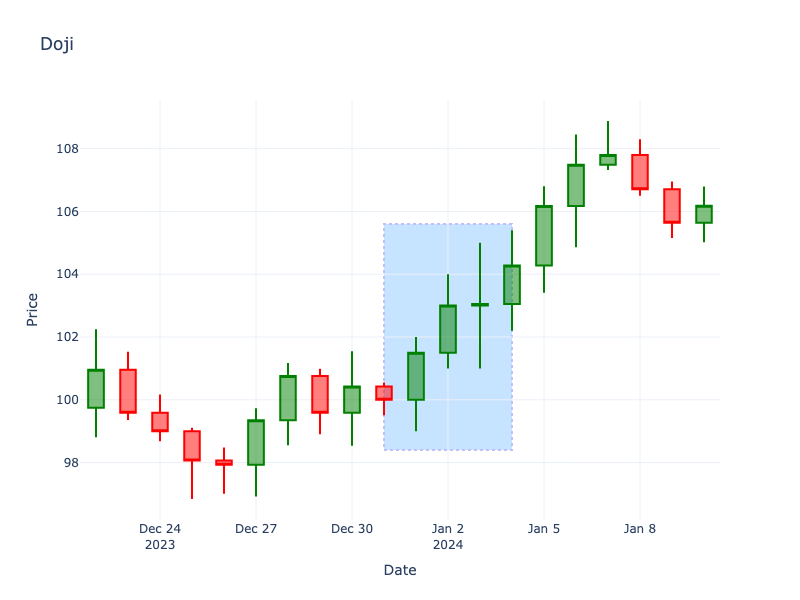
A Doji is a candlestick pattern that forms when a security's open and close are virtually equal for the given time period. The length of the upper and lower shadows can vary, and the resulting candlestick looks like a cross, inverted cross, or plus sign. A Doji indicates a sense of indecision or neutrality between buyers and sellers.
Pattern Structure
- Open and Close: Virtually the same.
- Shadows: Can be of varying lengths.
Mathematical Representation
\[
|Open - Close| \approx 0
\]
Visualization
Story
The market opens with a burst of activity, but as the session progresses, neither the buyers nor the sellers can gain the upper hand. The price swings back and forth, exploring highs and lows, but ultimately settles right back where it started. This profound indecision reflects a market in equilibrium, leaving traders holding their breath, waiting to see who will blink first in the next session.
Trading Significance
- Indecision: Represents a tug-of-war between buyers and sellers where neither side gains control.
- Reversal Signal: Often signals a reversal after a prolonged trend (uptrend or downtrend).
- Support/Resistance: Can mark key support or resistance levels.