Aroon Indicator
| Name | Type | Prerequisite | Use Cases |
|---|---|---|---|
| Aroon (ARN) | Trend | OHLC Data | Identifying the start of a new trend. |
Definition
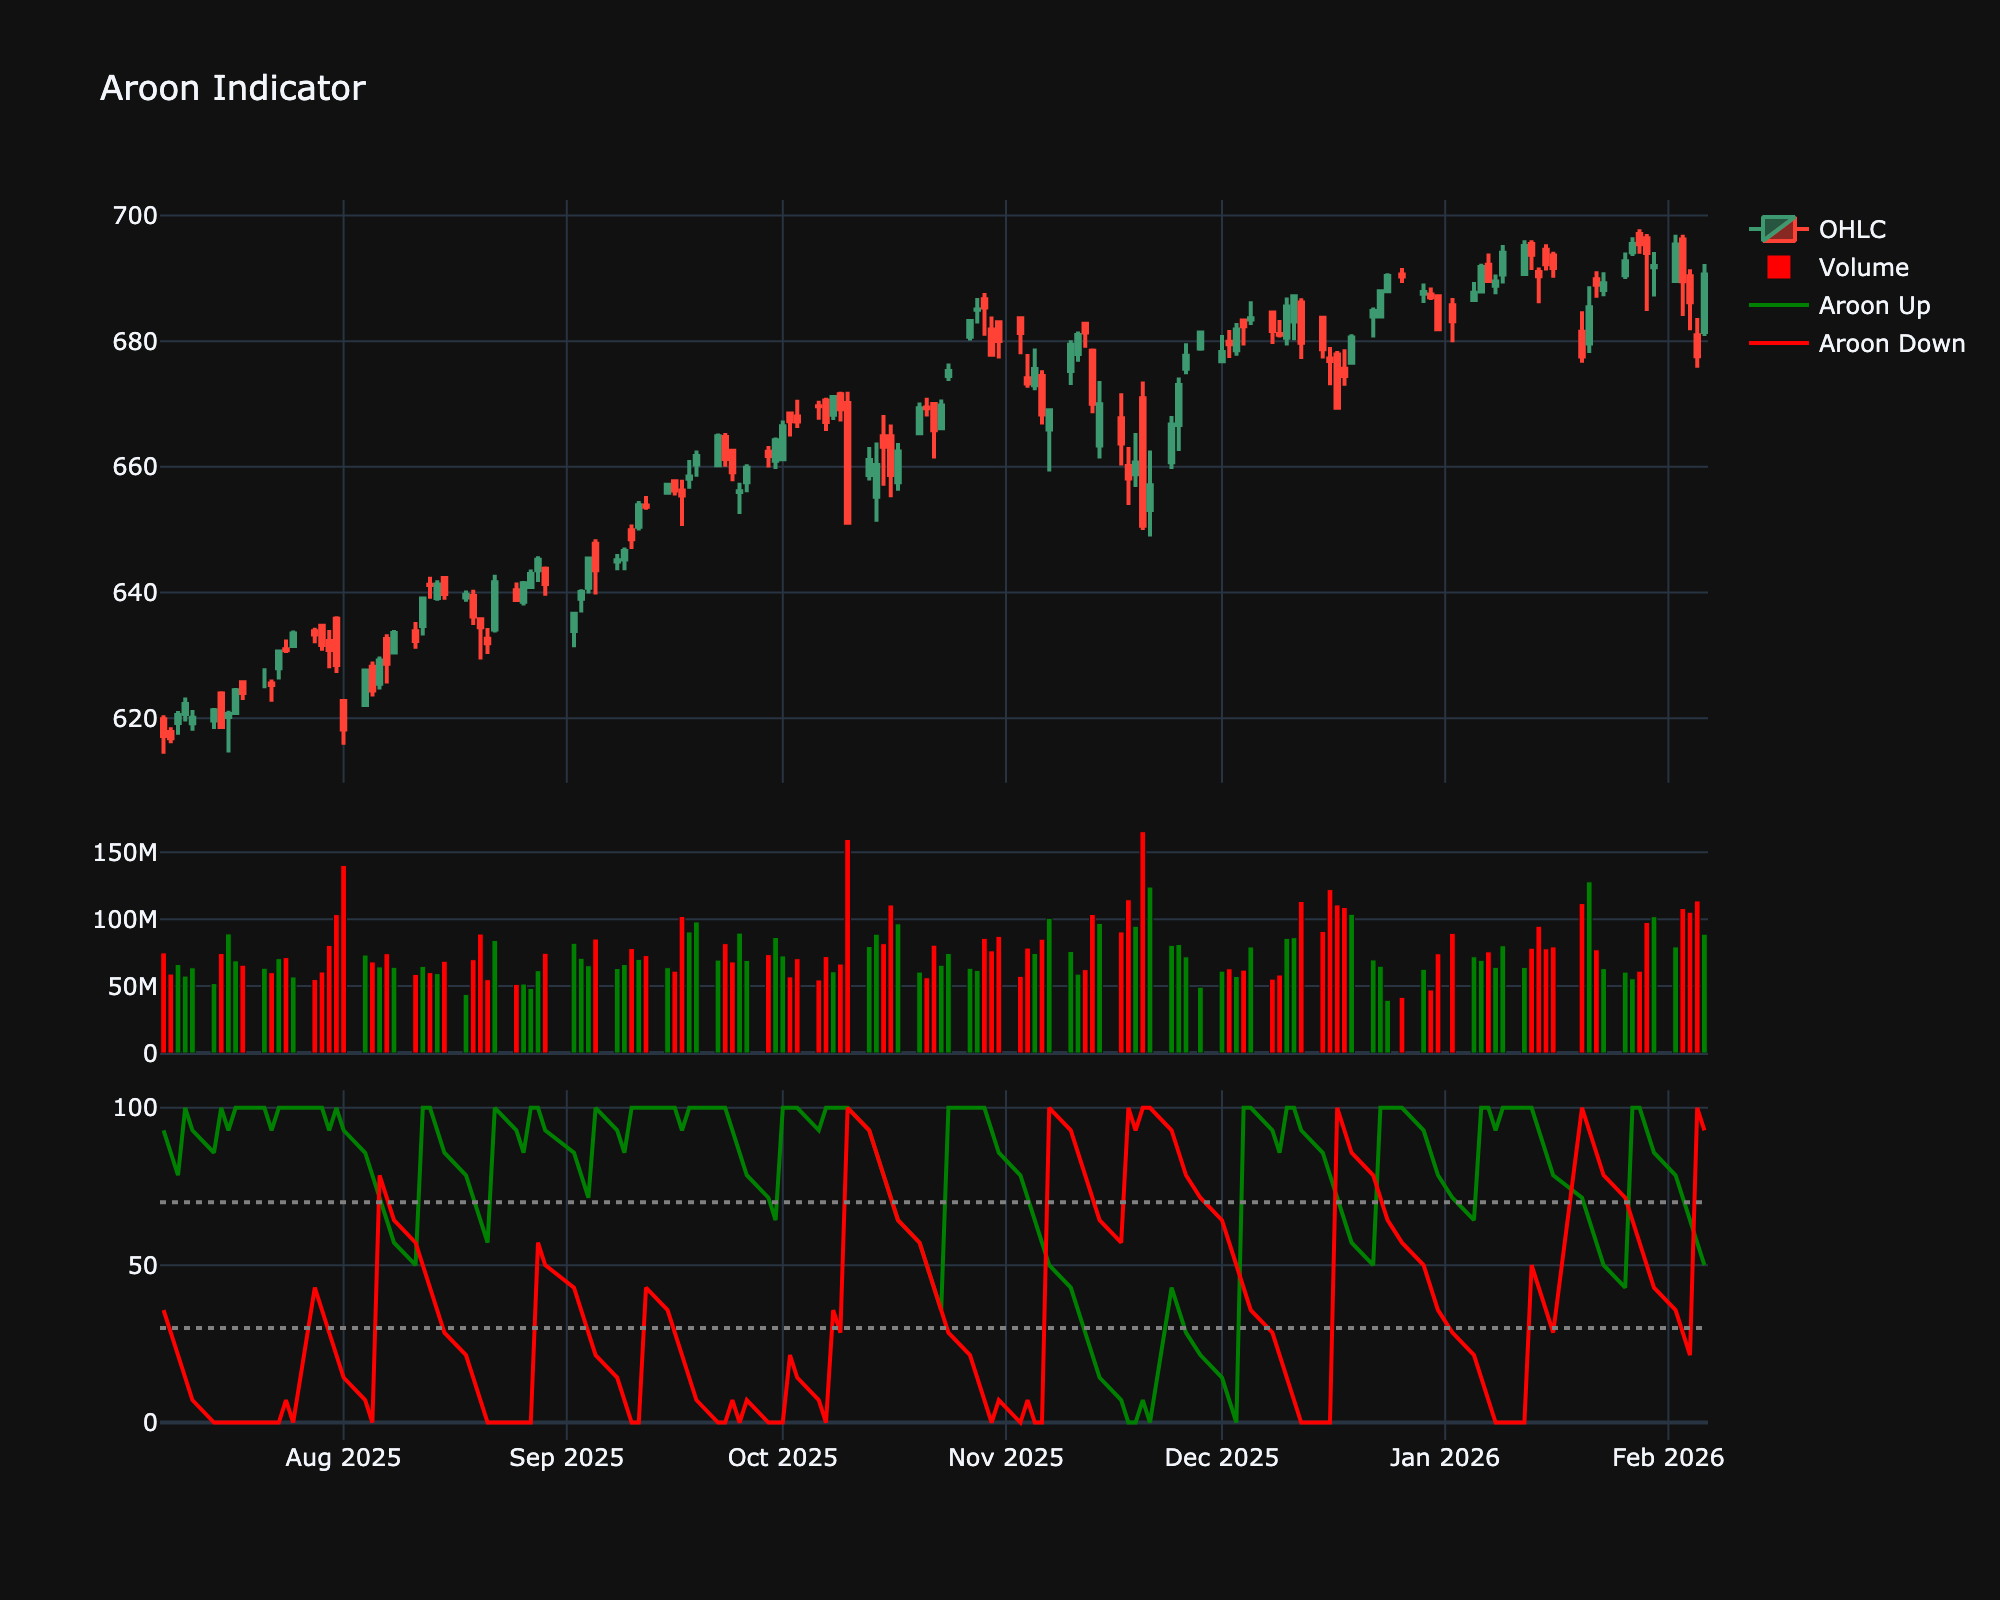
The Aroon indicator is used to identify trend changes in the price of an asset, as well as the strength of that trend. It measures the time between highs and the time between lows over a time period. The indicator consists of the "Aroon Up" line, which measures the strength of the uptrend, and the "Aroon Down" line, which measures the strength of the downtrend.
Mathematical Equation
The indicator is calculated over \(N\) periods (typically 25):
Special cases
- Maximum possible value: 100
- Minimum possible value: 0
- Behavior: Oscillates between 0 and 100, showing the time elapsed since the highest high or lowest low.
Visualization
Trading Significance
-
Trend Identification:
-
Uptrend: Aroon Up is above 70 and Aroon Down is below 30.
-
Downtrend: Aroon Down is above 70 and Aroon Up is below 30.
-
-
Crossovers:
-
When Aroon Up crosses above Aroon Down, it is a potential buy signal (trend change to bullish).
-
When Aroon Down crosses above Aroon Up, it is a potential sell signal (trend change to bearish).
-
-
Consolidation: If both lines are below 50 or moving parallel to each other, it suggests a consolidation phase or lack of a strong trend.