Chande Kroll Stop (CKS)
| Name | Type | Prerequisite | Use Cases |
|---|---|---|---|
| Chande Kroll Stop (CKS) | Volatility/Regime | ATR, High, Low | Dynamic stop losses that don't get hit by random noise. |
Definition
The Chande Kroll Stop is a volatility-based trend-following indicator developed by Tushar Chande and Stanley Kroll. It is designed to allow a trader to keep a position open as long as the trend is valid, while protecting profits by trailing the stop loss. The indicator calculates two lines: a "Long Stop" (for long positions) and a "Short Stop" (for short positions). These stops are derived from the Average True Range (ATR) and the highest highs/lowest lows of the asset, ensuring the stop is placed outside the typical noise of market volatility.
Mathematical Equation
The calculation involves three main steps: determining the ATR, calculating the initial stop levels, and then smoothing them to find the final stop lines.
- Calculate ATR: Compute the Average True Range over period \(P\) (usually 10).
- Calculate Preliminary Stops:
- High Stop: Highest High of \(P\) periods - (\(x \times\) ATR of \(P\) periods)
- Low Stop: Lowest Low of \(P\) periods + (\(x \times\) ATR of \(P\) periods)
- Calculate Final Stops:
- Stop Long: The Highest "High Stop" over the last \(Q\) periods (typically 20).
- Stop Short: The Lowest "Low Stop" over the last \(Q\) periods (typically 20).
Where: * \(P\) is the ATR length (e.g., 10). * \(x\) is the multiplier (e.g., 3). * \(Q\) is the lookback period for the stop (e.g., 20).
Special cases
- Maximum possible value: Unbounded
- Minimum possible value: 0
- Behavior: Follows the price, acting as a trailing stop loss level overlaid on the price chart.
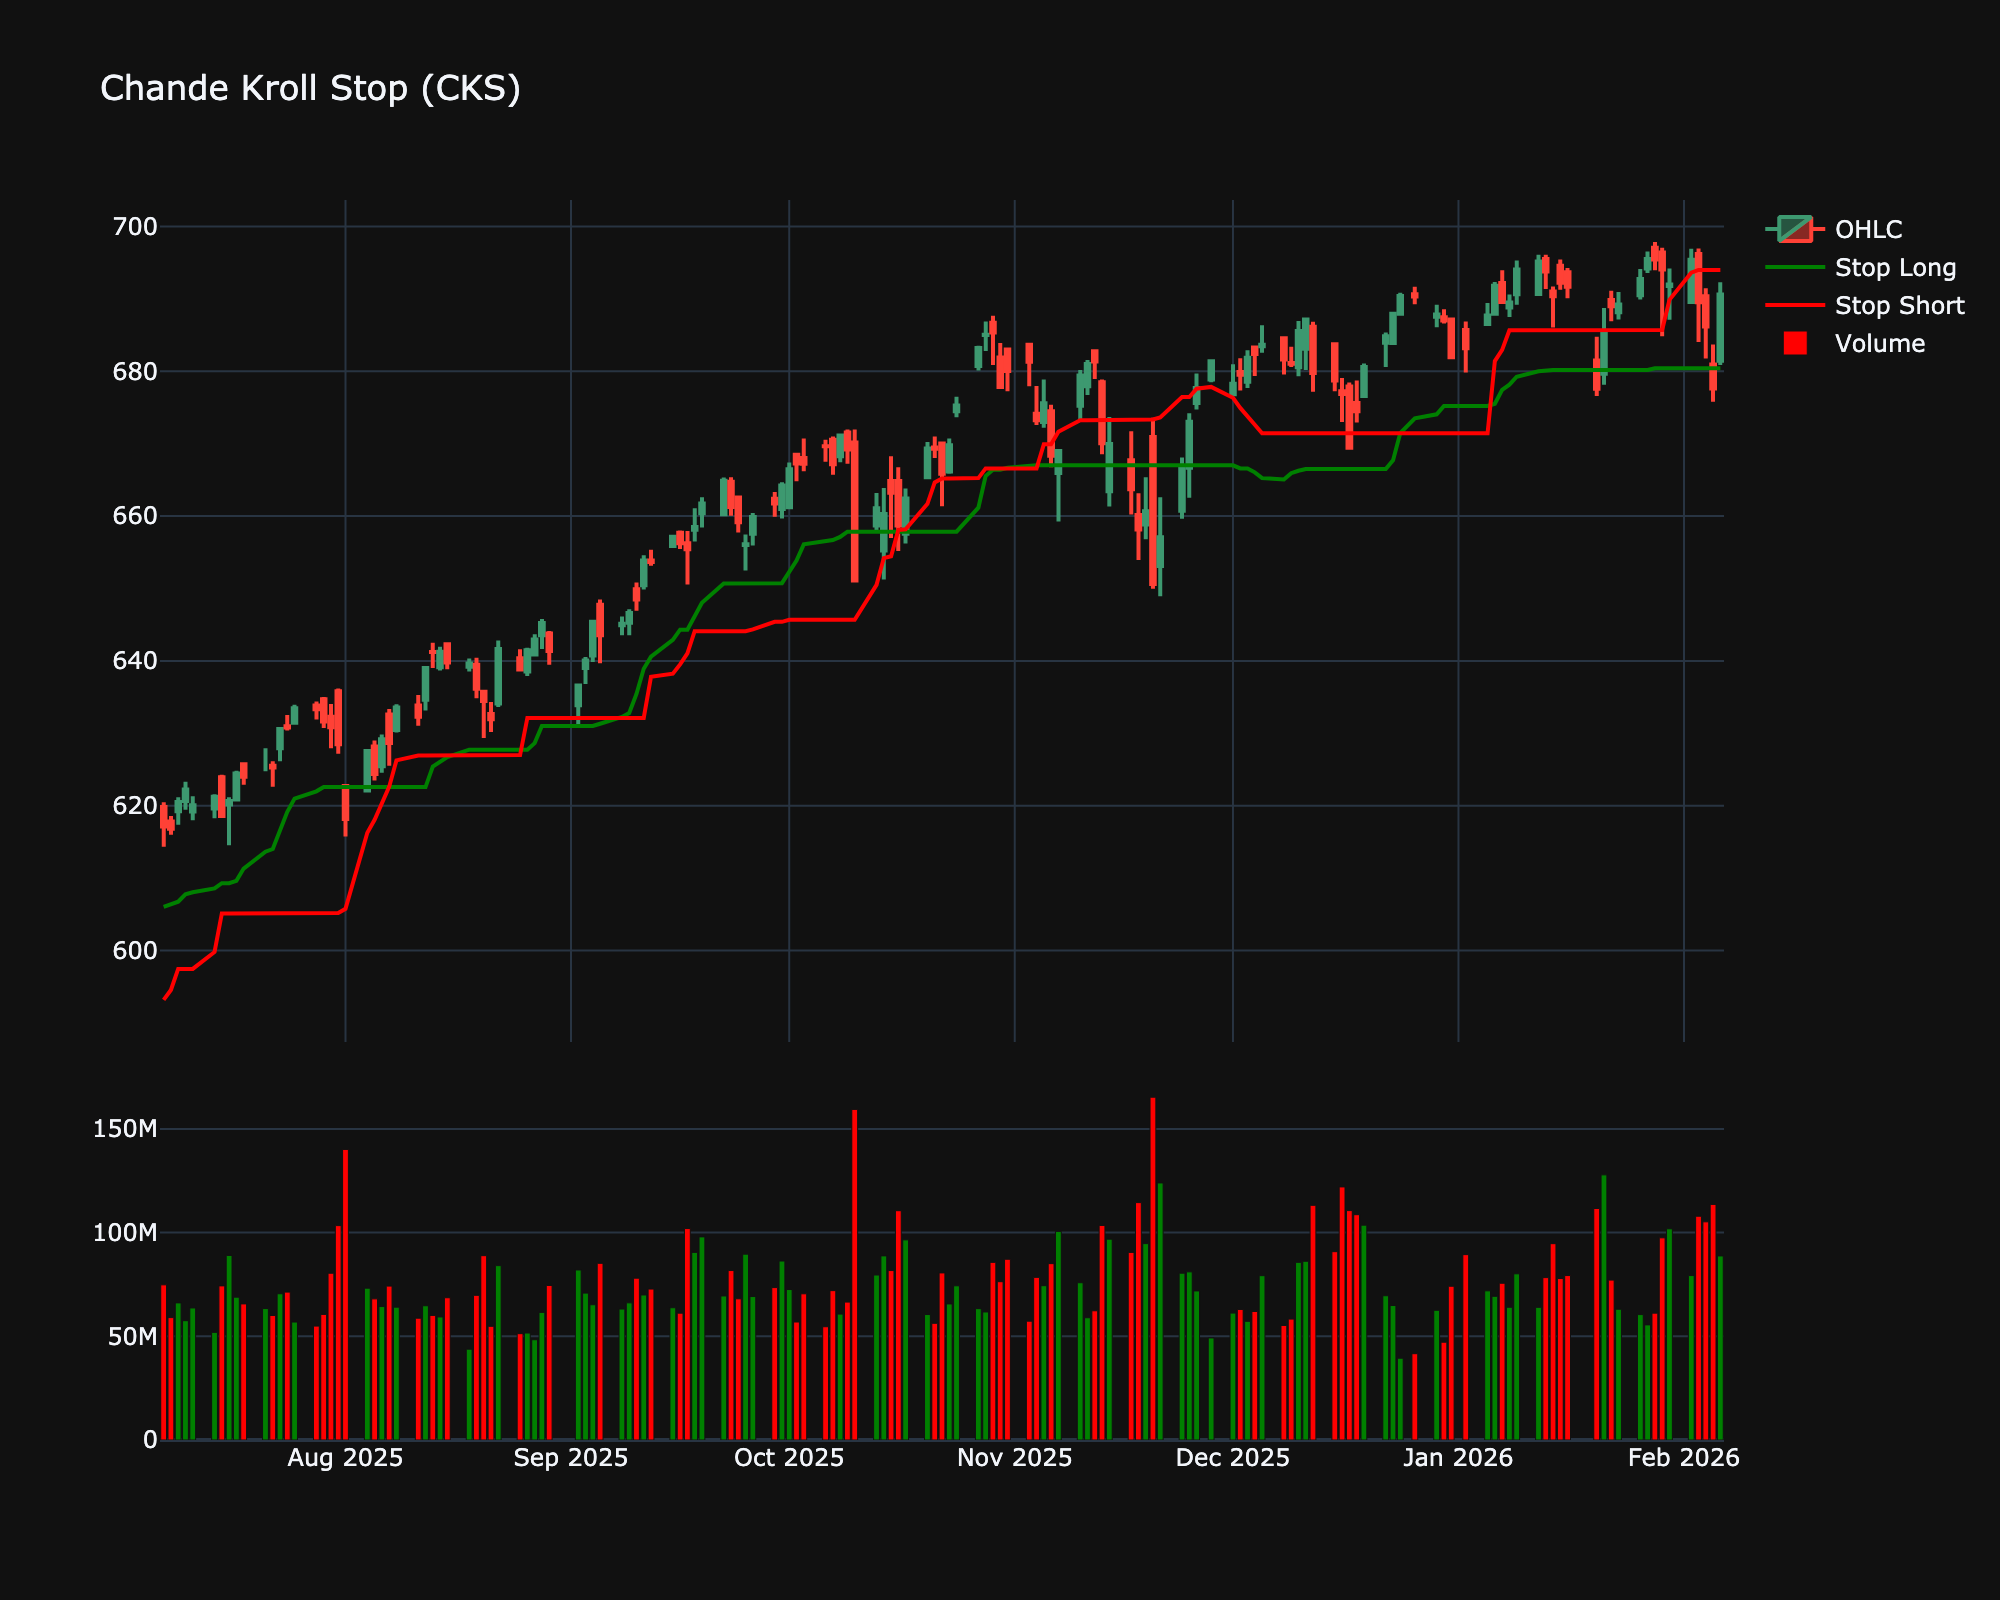
Visualization
Trading Significance
The Chande Kroll Stop is primarily used for exit management and trend confirmation:
-
Trailing Stop Loss: The primary use is to set stop-loss levels.
- Long Positions: Place the stop loss at the "Stop Long" line. As prices rise, the line rises, locking in profits. If price closes below this line, exit the trade.
- Short Positions: Place the stop loss at the "Stop Short" line. As prices fall, the line falls. If price closes above this line, exit the trade.
-
Trend Direction:
- Uptrend: Price is consistently above the "Stop Long" line.
- Downtrend: Price is consistently below the "Stop Short" line.
- Trend Reversal: A crossover of the price relative to the stop lines signals a potential trend change.
-
Crosses:
- The Green line (Stop Long) crossing above the Red line (Stop Short) acts as a specialized signal for trend strength, though the primary signal is Price vs. Stop Line.