Standard Error Bands
| Name | Type | Prerequisite | Use Cases |
|---|---|---|---|
| Standard Error Bands (SEB) | Volatility | SMA | Creating tighter bands that focus on the average's reliability. |
Definition
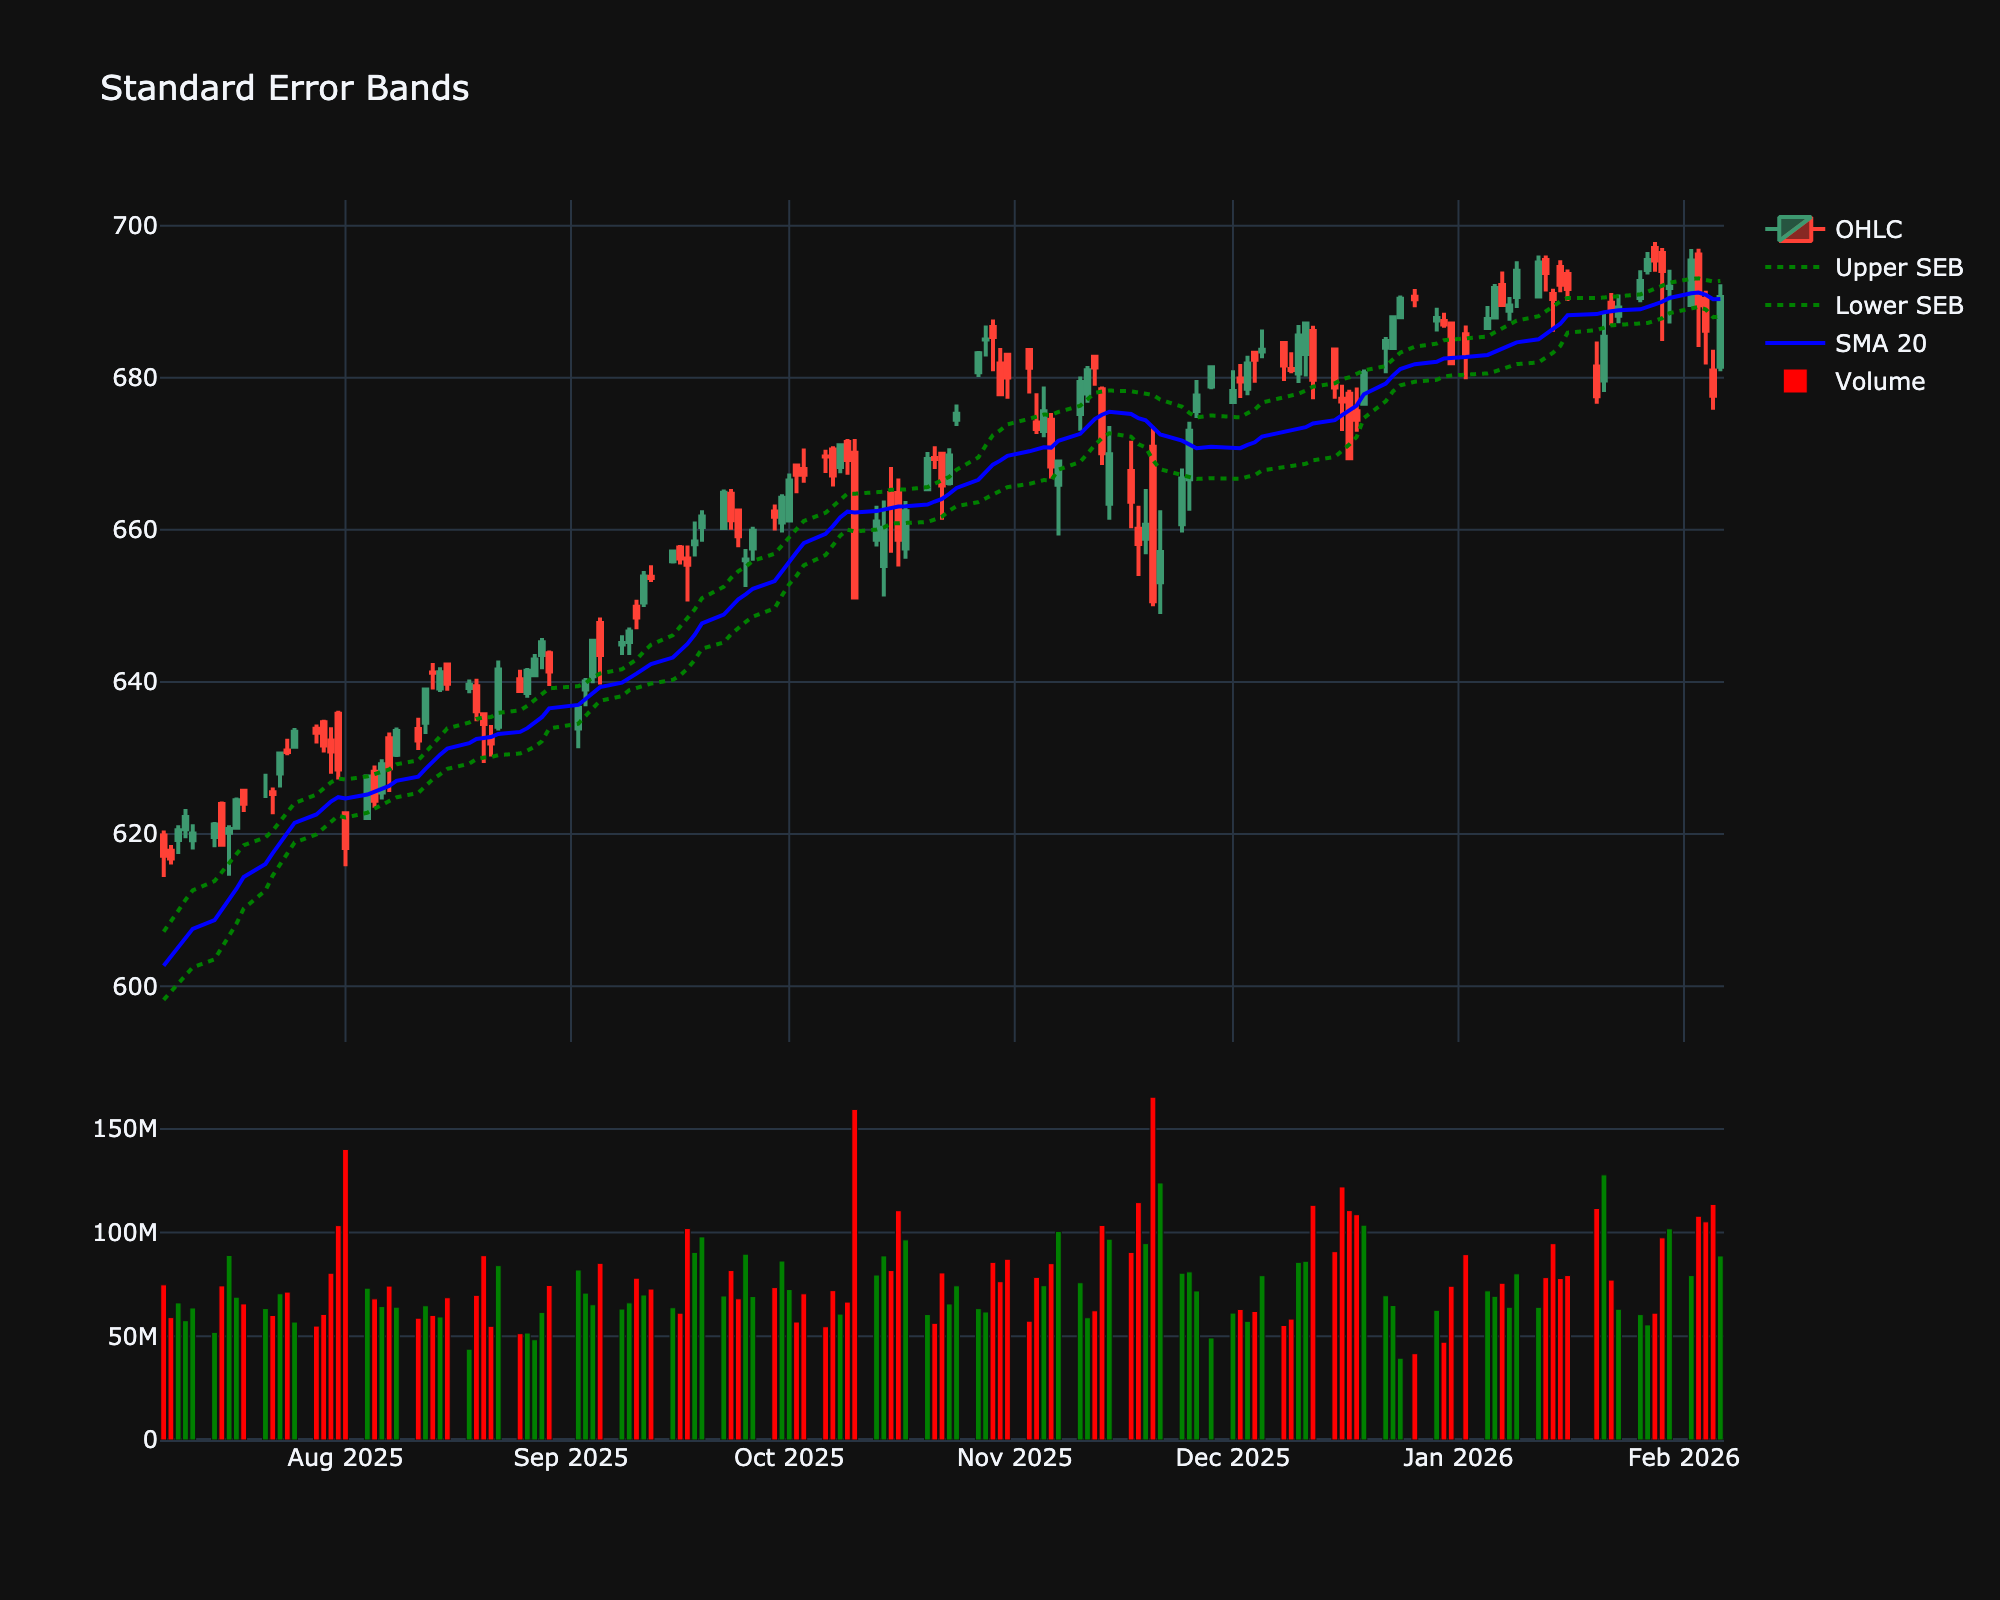
Standard Error Bands are similar to Bollinger Bands but use Standard Error instead of Standard Deviation. They are plotted around a Linear Regression Curve (or sometimes a SMA).
Mathematical Equation
-
Upper Band: \(LRC + 2 \times SE\)
-
Lower Band: \(LRC - 2 \times SE\)
-
Middle: Linear Regression Curve (LRC)
(Note: Sometimes plotted around SMA, but LRC is statistically consistent).
Special cases
- Maximum possible value: Unbounded
- Minimum possible value: 0
- Behavior: Follows the price, displaying the standard error of a linear regression over price.
Visualization
Trading Significance
-
Trend Channel: Prices tend to stay within the bands during a trend.
-
Tightening: Tight bands indicate a strong, low-volatility trend. Expanding bands indicate increasing volatility or trend instability.