Relative Strength Index (RSI)
| Name | Type | Prerequisite | Use Cases |
|---|---|---|---|
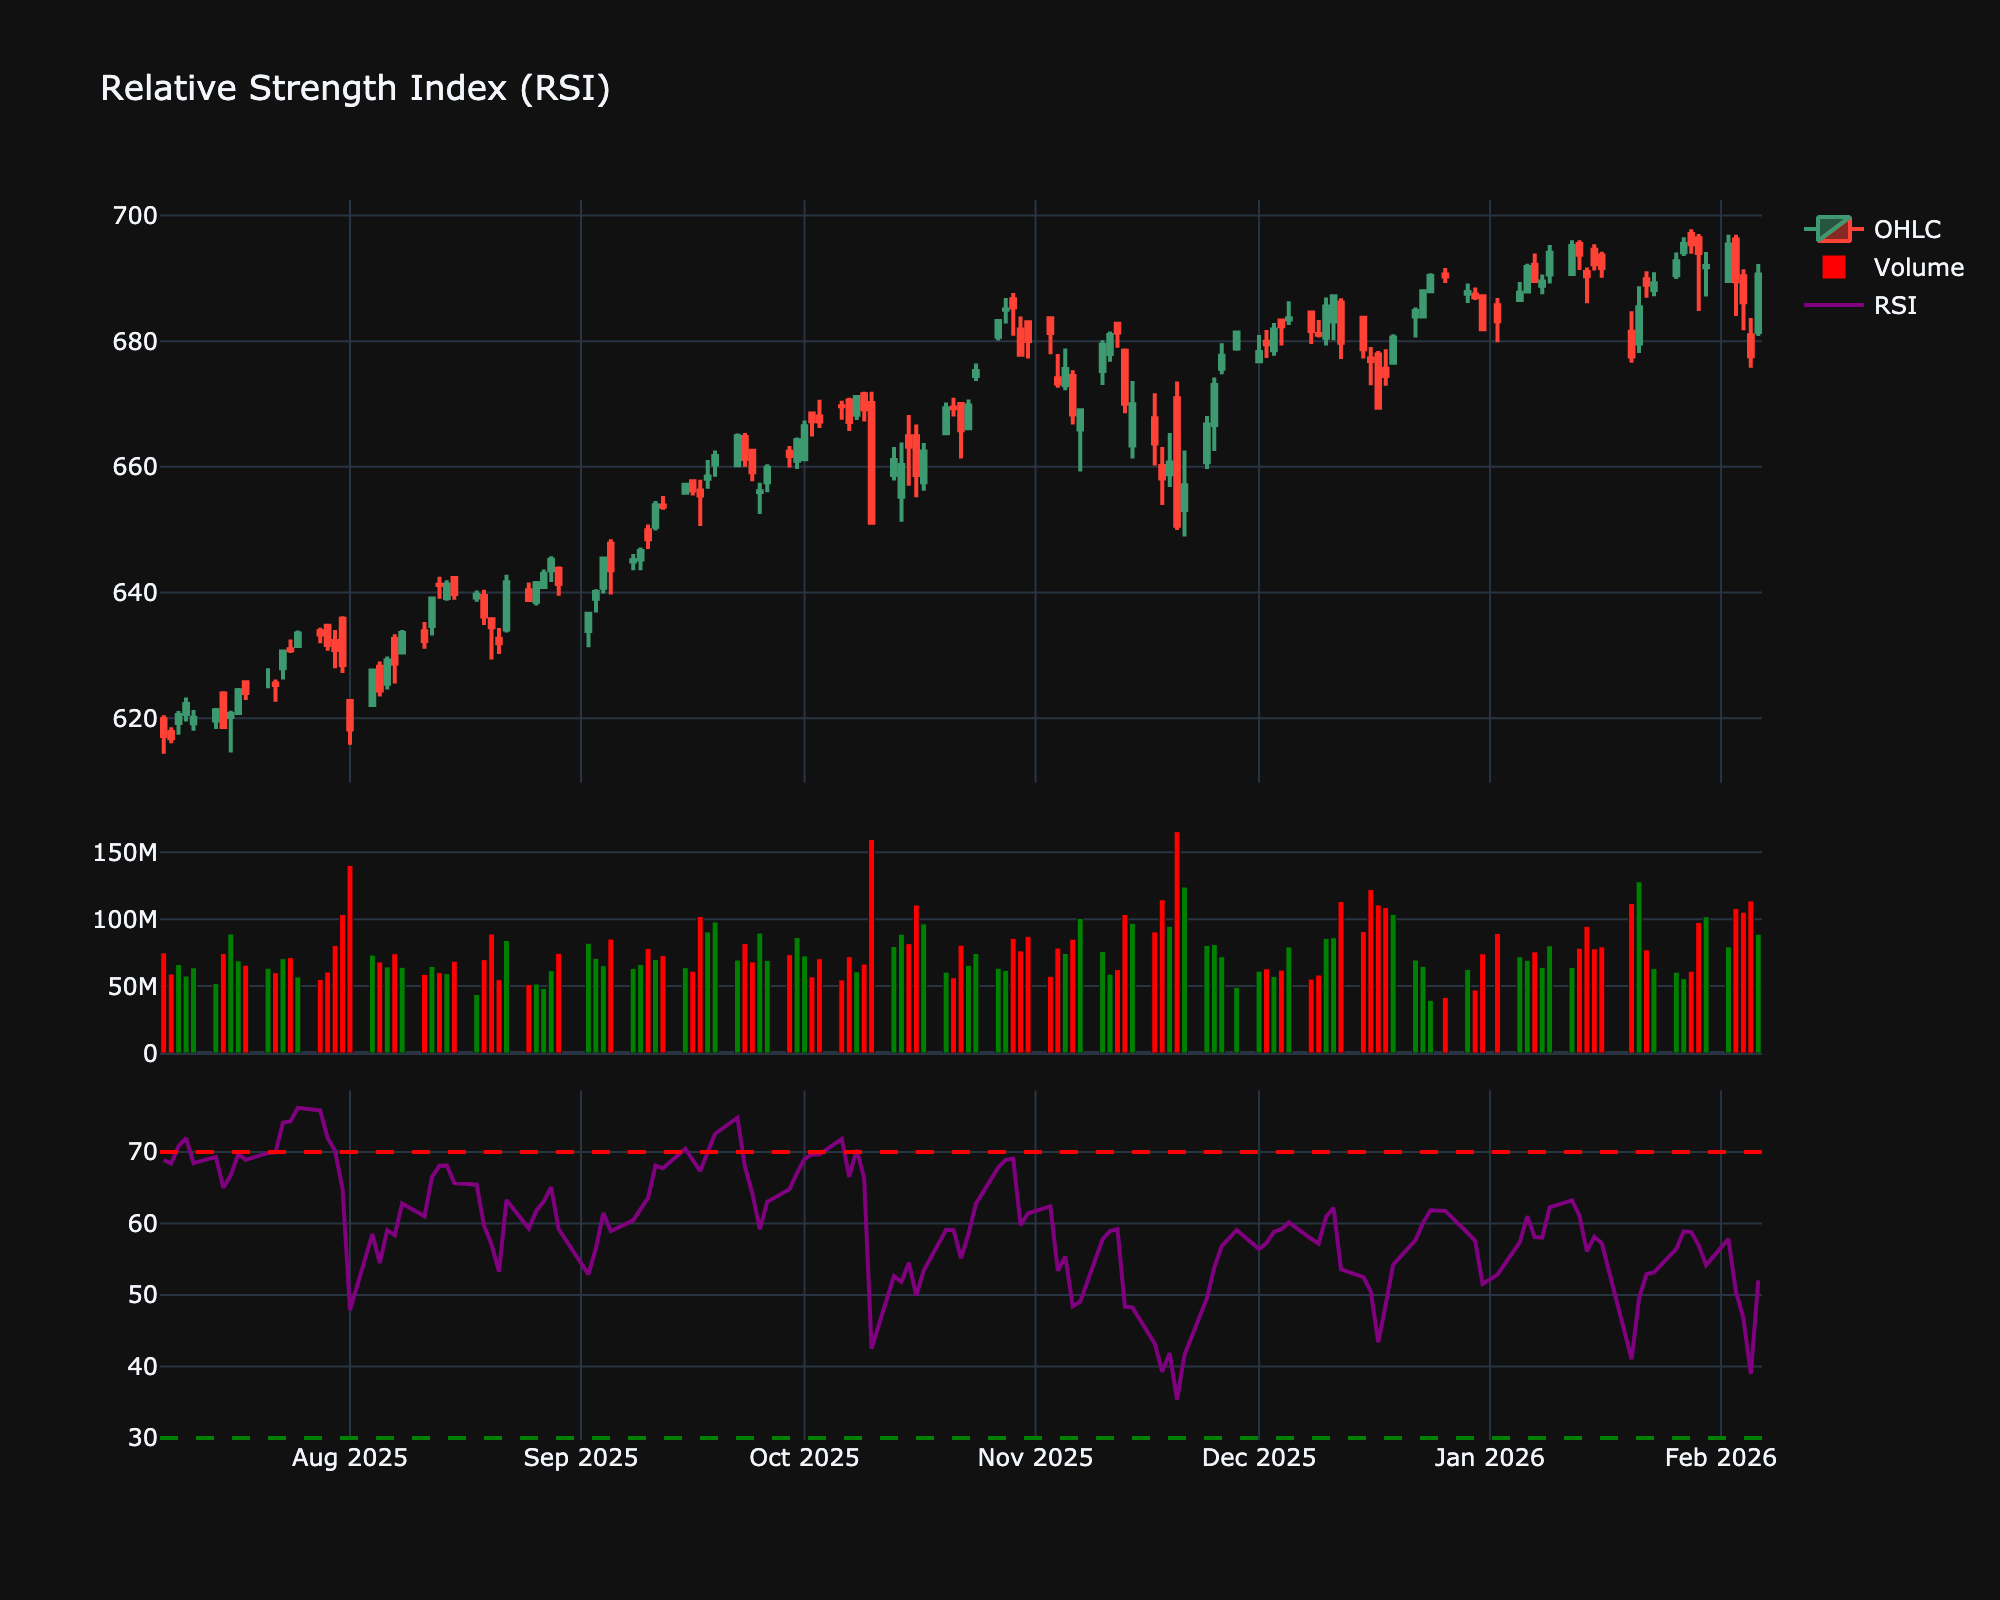
| Relative Strength Index (RSI) | Momentum | OHLC Data | Identifying overbought (>70) and oversold (<30) conditions. |
Definition
The Relative Strength Index (RSI) is a momentum oscillator that measures the speed and change of price movements. The RSI oscillates between zero and 100. It is traditionally used to identify overbought or oversold conditions in the trading of an asset.
Mathematical Equation
The RSI calculation involves two steps. First, the Relative Strength (RS) is computed:
The Average Gain and Average Loss are typically calculated using a smoothing method (like RMA/SMMA) over a lookback period (usually 14 periods).
Then, the RSI is calculated from the RS:
Special cases
- Maximum possible value: 100
- Minimum possible value: 0
- Behavior: Oscillates between 0 and 100, highlighting overbought (typically >70) and oversold (<30) conditions.
Visualization
Trading Significance
-
Overbought/Oversold Levels: Traditionally, an RSI above 70 indicates that a security is becoming overbought or overvalued and may be primed for a trend reversal or corrective pullback. An RSI reading below 30 indicates an oversold or undervalued condition.
-
Divergence: Divergence occurs when the asset price moves in the opposite direction of the RSI.
-
Bullish Divergence: Price makes a new low, but RSI makes a higher low.
-
Bearish Divergence: Price makes a new high, but RSI makes a lower high.
-
-
Centerline Cross: A move above 50 indicates buying momentum, while a move below 50 indicates selling momentum.