Chaikin Oscillator
| Name | Type | Prerequisite | Use Cases |
|---|---|---|---|
| Chaikin Oscillator (CO) | Volume/Momentum | EMA | Identifying momentum in volume flow. |
Definition
The Chaikin Oscillator is a volume-based indicator that measures the accumulation-distribution of money flow into and out of a security. It is calculated as the difference between a 3-day exponential moving average (EMA) of the Accumulation/Distribution Line (ADL) and a 10-day EMA of the ADL. It helps identifying momentum in the buying or selling pressure.
Mathematical Equation
First, calculate the Accumulation/Distribution Line (ADL):
\[
\text{MF Multiplier} = \frac{(Close - Low) - (High - Close)}{High - Low}
\]
\[
\text{MF Volume} = \text{MF Multiplier} \times \text{Volume}
\]
\[
ADL = \text{Previous ADL} + \text{MF Volume}
\]
Then, calculate the Chaikin Oscillator:
\[
\text{Chaikin Oscillator} = EMA_3(ADL) - EMA_{10}(ADL)
\]
Special cases
- Maximum possible value: Unbounded
- Minimum possible value: Unbounded
- Behavior: Oscillates around a zero line based on the momentum of the Accumulation/Distribution Line.
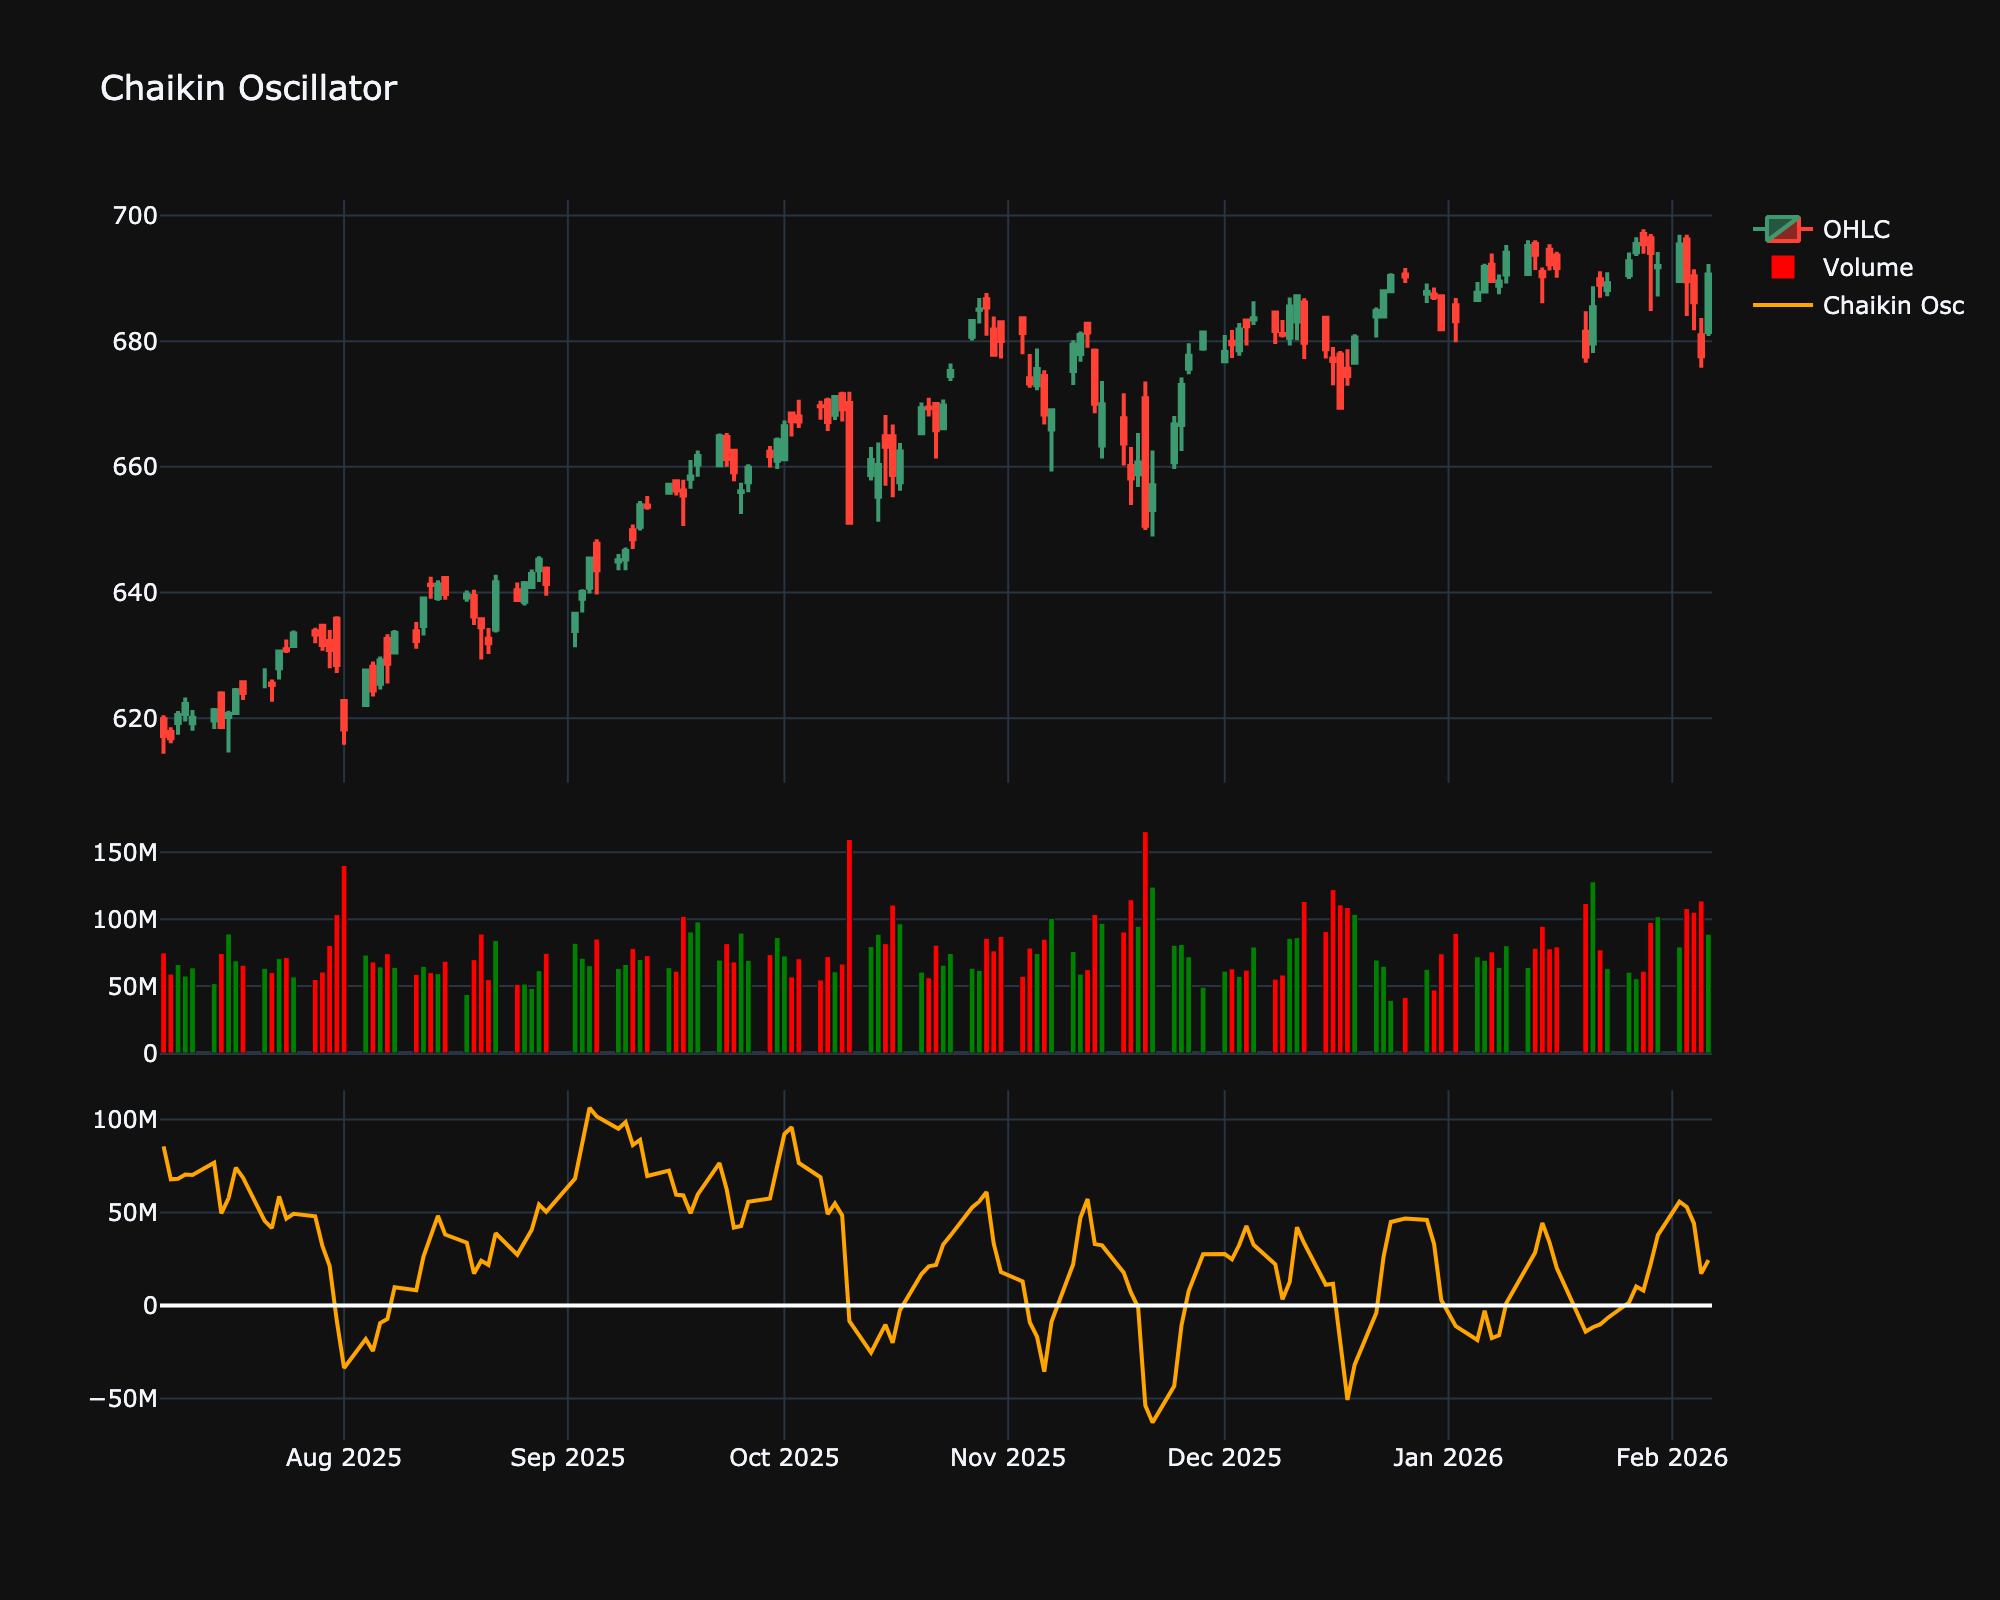
Visualization
Trading Significance
-
Centerline Crossover:
-
Bullish: Crossing above the zero line suggests money is flowing into the security (accumulation).
-
Bearish: Crossing below the zero line suggests money is flowing out (distribution).
-
-
Divergence: Divergence between the indicator and price often precedes a reversal.
- Bullish divergence occurs when price hits a new low but the oscillator makes a higher low.