Bollinger Bands
| Name | Type | Prerequisite | Use Cases |
|---|---|---|---|
| Bollinger Bands (BB) | Volatility | StdDev, SMA | Identifying "overextended" prices and volatility squeezes. |
Definition
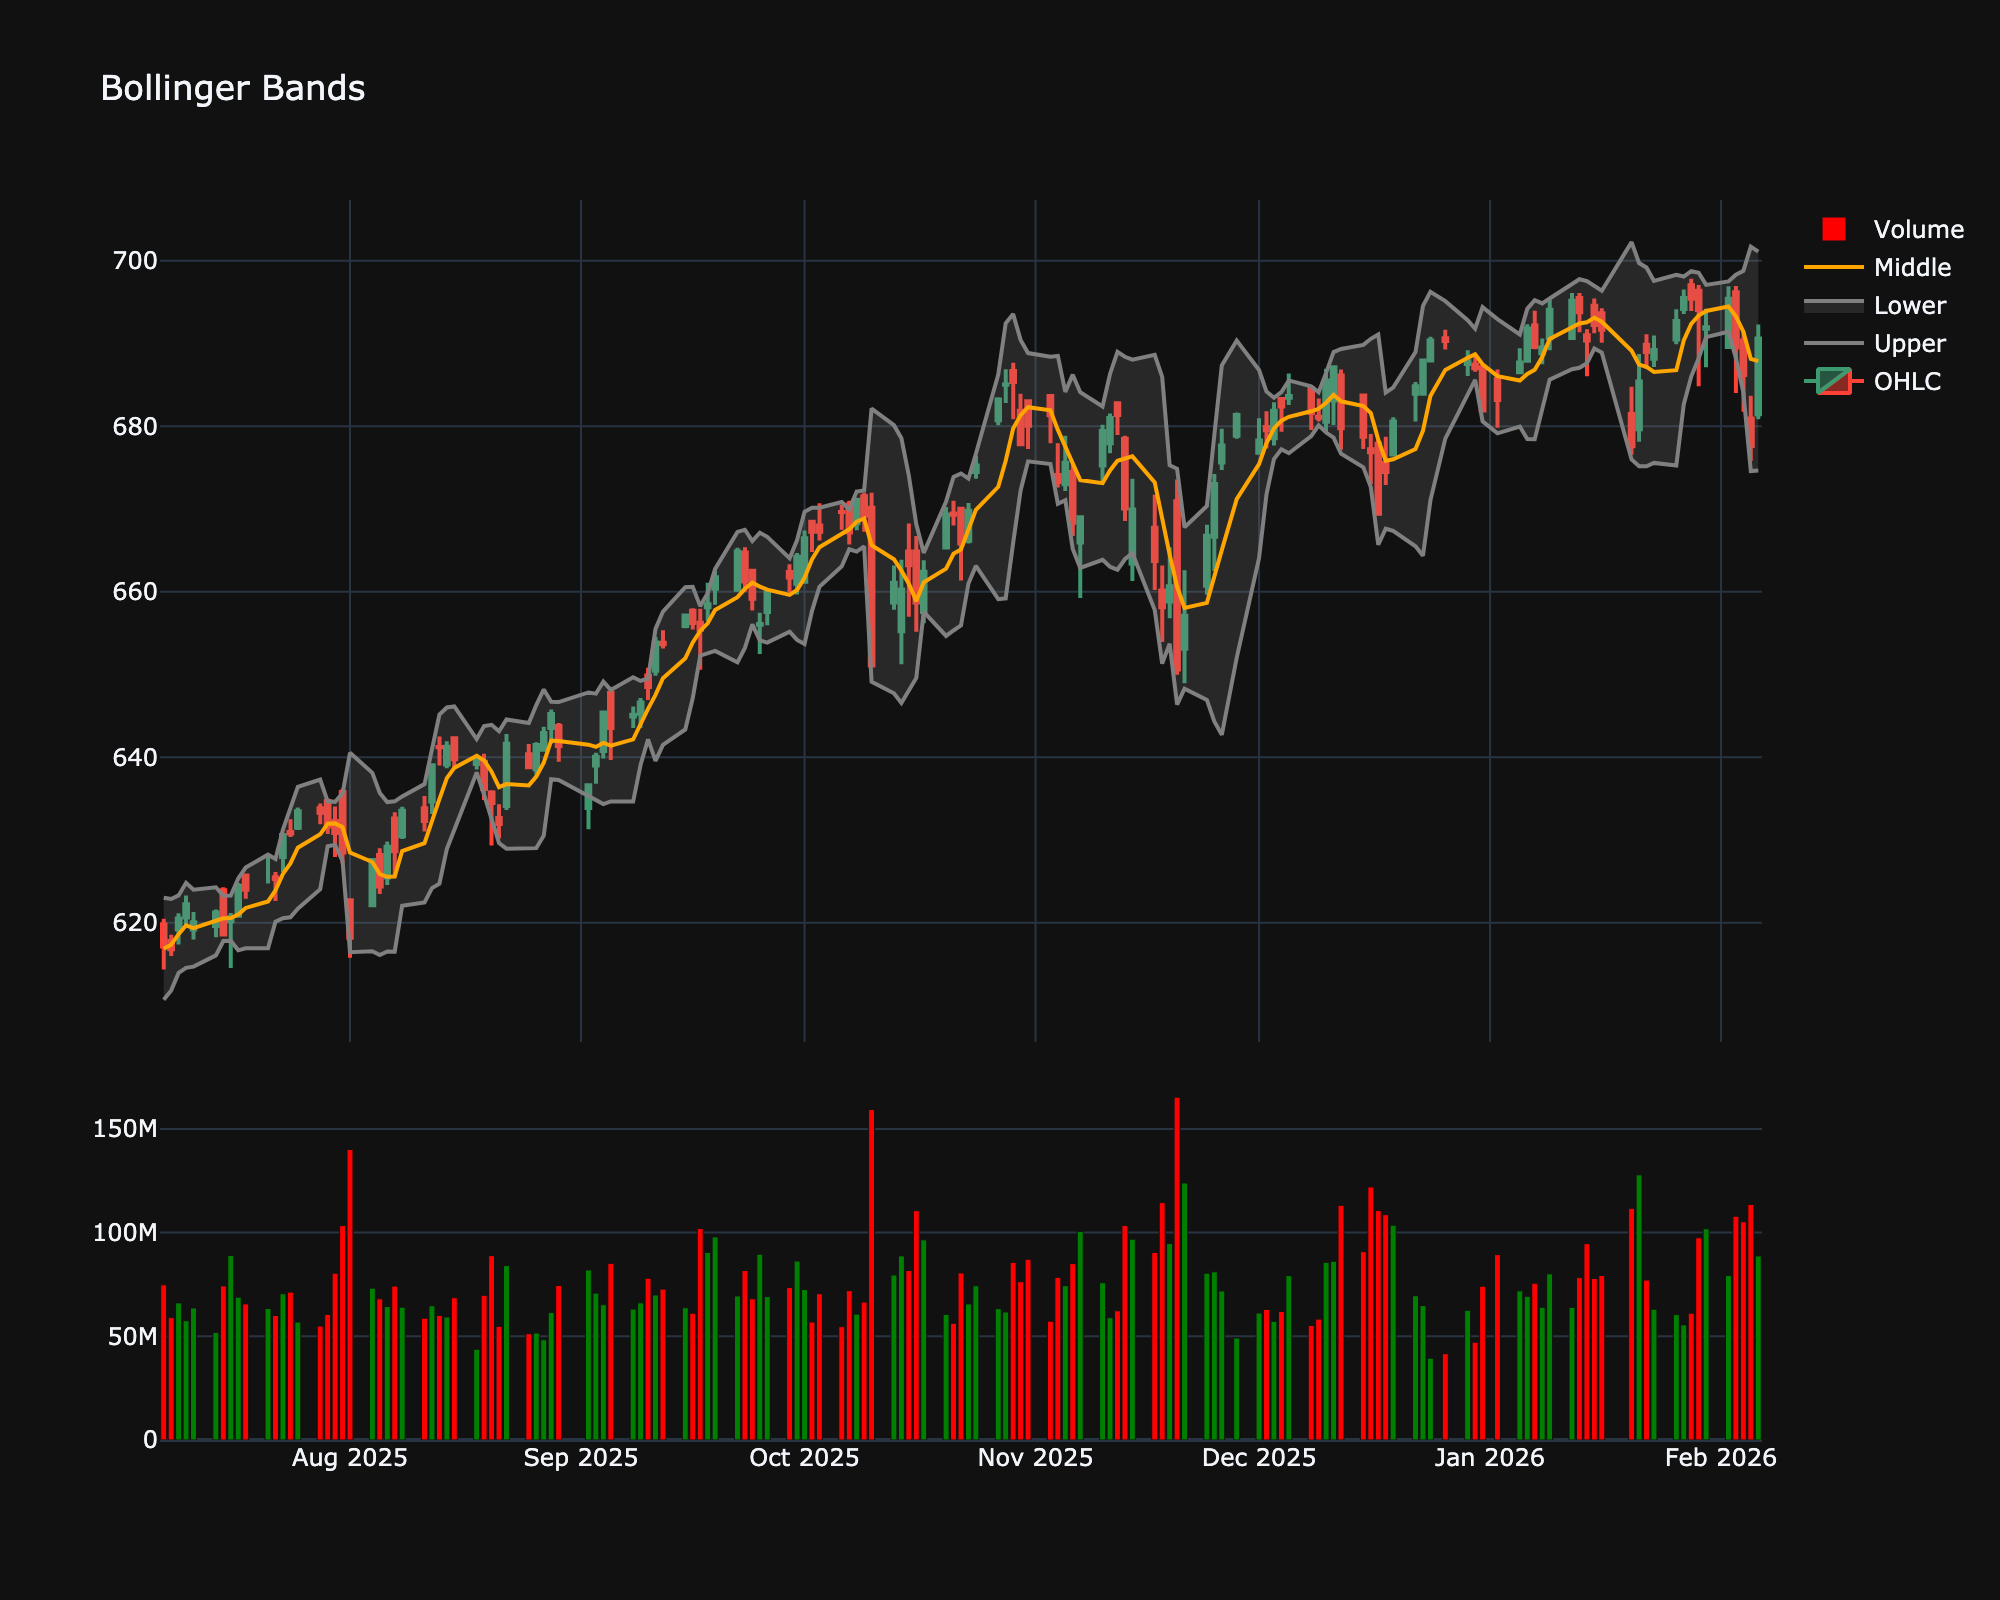
Bollinger Bands are a technical analysis tool defined by a set of trendlines plotted two standard deviations (positively and negatively) away from a simple moving average (SMA) of a security's price. They are used to measure market volatility and identify overbought or oversold conditions.
Mathematical Equation
Bollinger Bands consist of three lines:
Middle Band: A simple moving average (usually 20 periods).
Where \(\sigma_{20}\) is the standard deviation of the price over the same 20 periods.
Special cases
- Maximum possible value: Unbounded
- Minimum possible value: 0
- Behavior: Follows the price, forming an envelope around it to show volatility and relative price levels.
Visualization
Trading Significance
-
Squeeze: When the bands tighten (come closer together), it indicates low volatility and is often followed by a sharp price move (breakout). This is known as a "Squeeze".
-
Breakputs: A move outside the bands can signal a continuation of the trend, although price often reverts to the mean.
-
W-Bottoms: A double bottom where the second low is lower than the first but holds above the Lower Band is a bullish sign.
-
M-Tops: A double top where the high is higher than the first but fails to touch the Upper Band is a bearish sign.
-
Trend Trading: In a strong uptrend, price tends to hug the Upper Band. In a strong downtrend, price hugs the Lower Band.