Stochastic RSI (StochRSI)
| Name | Type | Prerequisite | Use Cases |
|---|---|---|---|
| Stochastic RSI (StochRSI) | Momentum | OHLC Data | Identifying RSI reversals with high sensitivity. |
Definition
The Stochastic RSI (StochRSI) is an indicator used to measure the level of the RSI relative to its high-low range over a set time period. It essentially applies the Stochastic formula to RSI values instead of Price values. This makes it a more sensitive indicator, capable of generating more overbought/oversold signals than the standard RSI.
Mathematical Equation
Where the min and max are calculated over the lookback period (e.g., 14). The result is a value between 0 and 1 (or 0 and 100).
Special cases
- Maximum possible value: 1 (or 100)
- Minimum possible value: 0
- Behavior: Oscillates between 0 and 1 (or 100), increasing sensitivity to the standard RSI.
Visualization
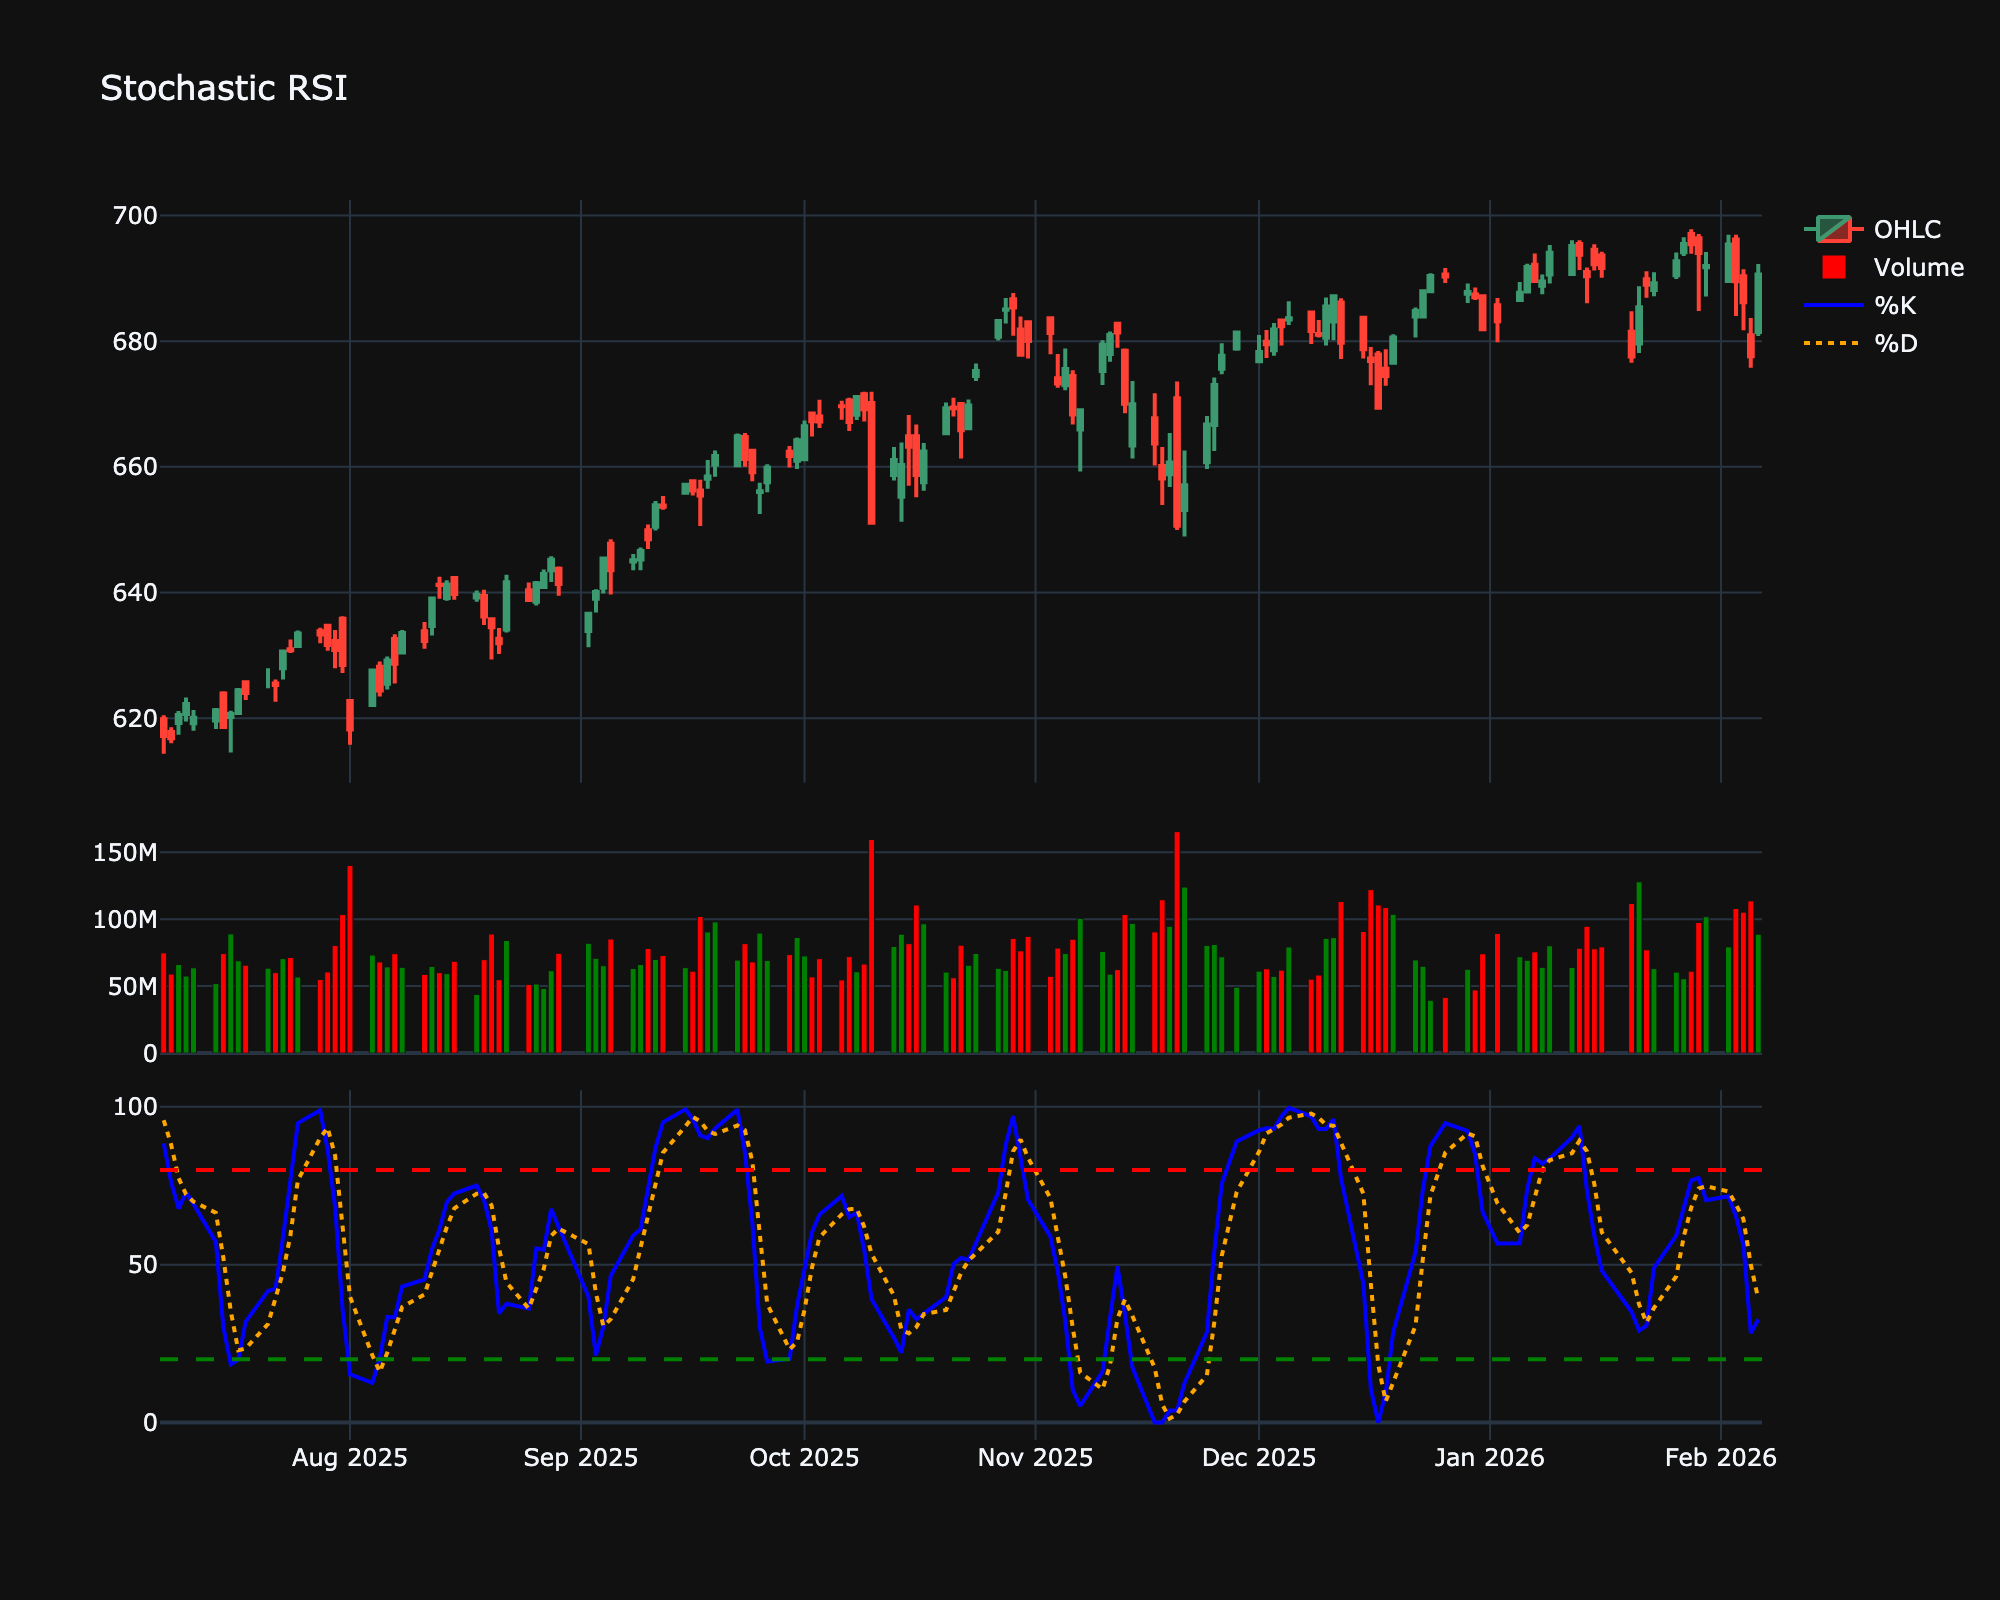
Trading Significance
-
Overbought/Oversold: StochRSI defines overbought as above 0.80 (80) and oversold as below 0.20 (20).
-
Sensitivity: Because it is an indicator of an indicator, it moves faster. It is best used to identify short-term trends within a larger trend determined by other tools.
-
Crossovers: The %K and %D lines within the StochRSI can provide crossover signals similar to the value Stochastic Oscillator.