Moving Average Convergence Divergence (MACD)
| Name | Type | Prerequisite | Use Cases |
|---|---|---|---|
| Moving Average Convergence Divergence (MACD) | Momentum | EMA | Identifying momentum shifts and signal line crossovers. |
Definition
The Moving Average Convergence Divergence (MACD) is a trend-following momentum indicator that shows the relationship between two moving averages of a security's price. It is one of the most popular tools in technical analysis because it provides signals for both trend direction and momentum strength.
Mathematical Equation
The MACD is calculated by subtracting the long-term EMA (26 periods) from the short-term EMA (12 periods).
A "Signal Line", which is a 9-day EMA of the MACD Line, is then plotted on top of the MACD Line:
Finally, the MACD Histogram represents the difference between the MACD Line and the Signal Line:
Special cases
- Maximum possible value: Unbounded
- Minimum possible value: Unbounded
- Behavior: Oscillates around a zero line, showing the convergence and divergence of two moving averages.
Visualization
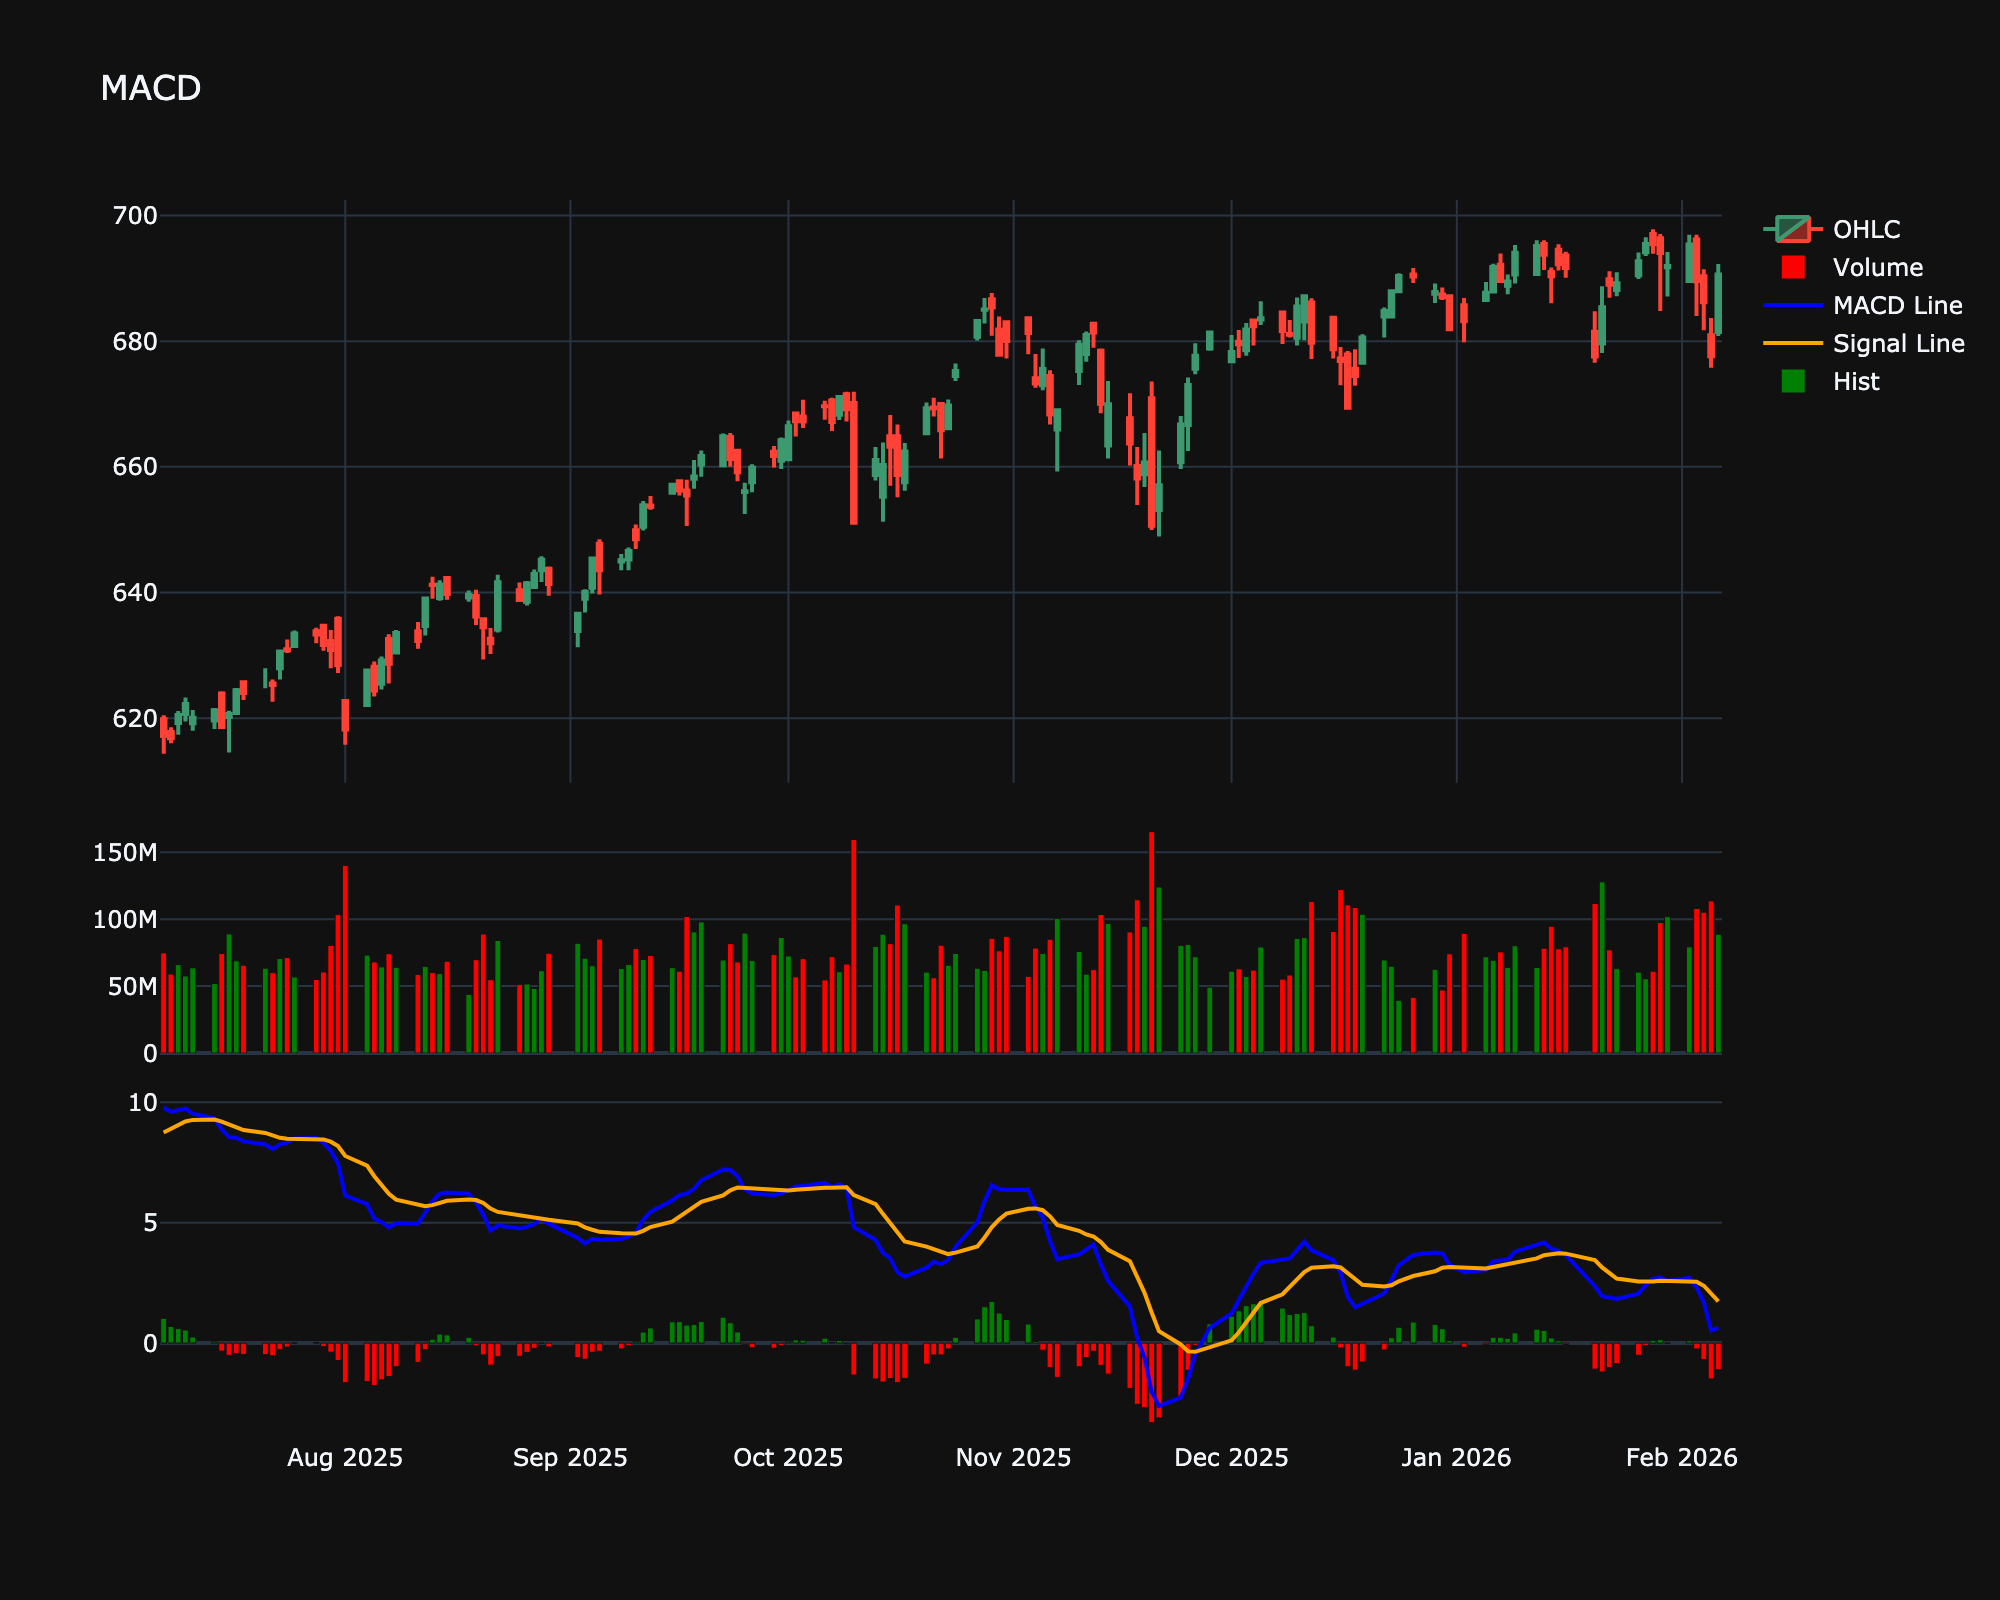
Trading Significance
-
Signal Line Crossovers:
-
Bullish: The MACD Line crosses above the Signal Line.
-
Bearish: The MACD Line crosses below the Signal Line.
-
-
Zero Line Crossovers:
-
Bullish: The MACD Line crosses above the zero line (short-term EMA above long-term EMA).
-
Bearish: The MACD Line crosses below the zero line.
-
-
Divergence: When the security price diverges from the MACD, it signals the end of the current trend.
-
Bullish Divergence: Price records a lower low, but MACD forms a higher low.
-
Bearish Divergence: Price records a higher high, but MACD forms a lower high.
-